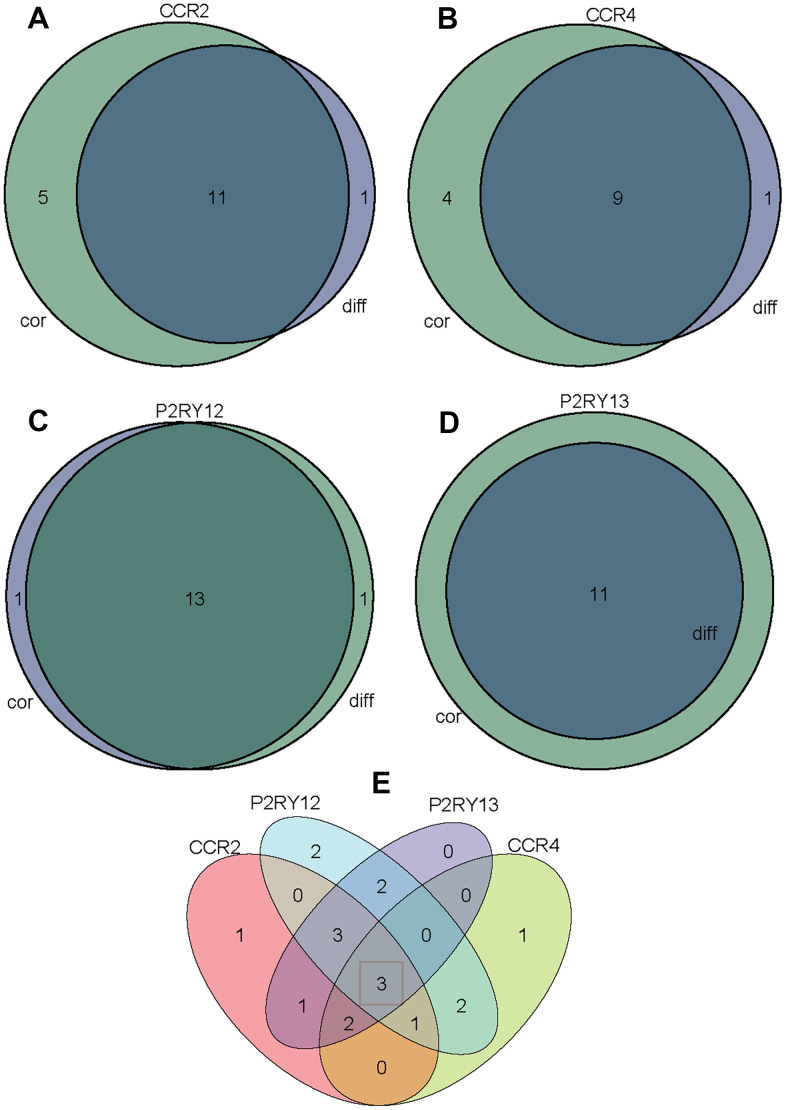
Figure 9.
Venn diagram analysis of aberrantly TIICs based on the difference analysis method and correlation analysis method. (A) Venn diagram indicating 11 kinds of TIICs correlated with CCR2 expression co-determined by difference and correlation analysis displayed in violin and scatter plots, respectively. (B) Venn diagram indicating 9 kinds of TIICs correlated with CCR4 expression co-determined by difference and correlation analysis displayed in violin and scatter plots, respectively. (C) Venn diagram indicating 13 kinds of TIICs correlated with P2RY12 expression co-determined by difference and correlation analysis displayed in violin and scatter plots, respectively. (D) Venn diagram indicating 11 kinds of TIICs correlated with P2RY13 expression co-determined by difference and correlation analysis displayed in violin and scatter plots, respectively. (E) Venn diagram indicating 3 kinds of TIICs that were co-related by these four genes.

