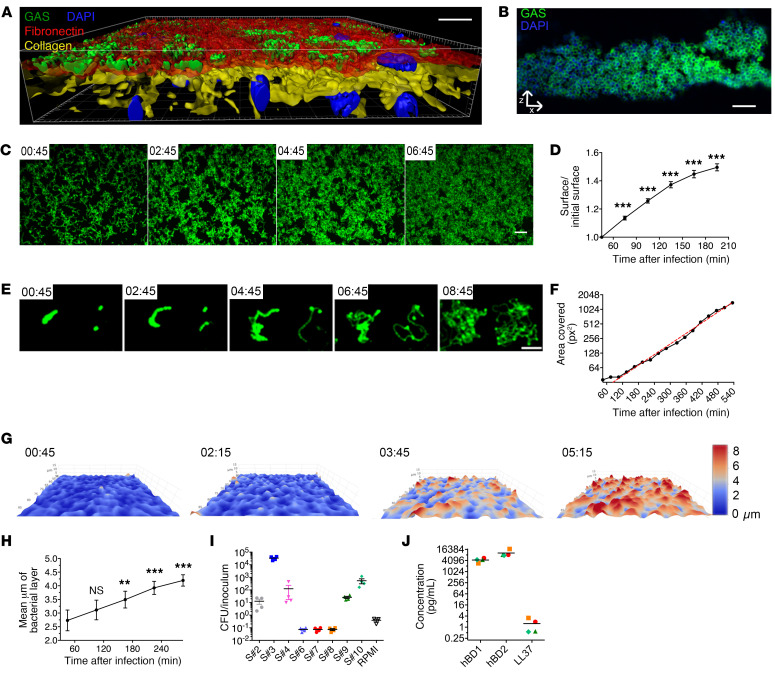
Figure 1. GAS adheres to the decidua and grows on it using tissue-secreted products.
(A) Imaris 3D representation of a tissue infected 16 hours and imaged en face. Fibronectin, red; type IV collagen, yellow; GFP-GAS, green; DAPI, blue. Scale bar: 20 μm. Magnification: ×40. (B) Immunofluorescence of a paraffin-embedded tissue transverse slice (24 hpi). Anti-GAS, green; DAPI, blue. Scale bar: 10 μm. Magnification: ×100. (C and E) z-Max intensity projections of GFP signals from live en face acquisition images of GFP-WT at the tissue surface, at indicated time points (hr:min). Scale bars: 10 μm (C) and 20 μm (E). Magnification: ×25. (D) Ratio over time of the area covered by WT GFP-GAS signal area in tissues from 5 samples including those in C. Mean values of 3 to 11 fields for each of the 5 tissues are plotted. (F) Quantification of the surface covered by GFP-GAS from the image in E. Red dotted line, exponential curve fitted starting at 105 minutes; R2 = 0.9948. (G) 3D surface heatmap of the bacterial layer thickness at different time points (hr:min) (live imaging). The x, y, and z axes are scaled, color code in micrometers. Image size: 303 × 190 μm. (H) Quantification of bacterial layer mean thickness; mean values of 2 to 13 fields for each of 5 tissues are plotted. (I) Multiplication factor after GAS incubation for 8 hours in tissue-conditioned medium or RPMI. S# indicates the sample number. (J) Basal levels of accumulation of the indicated antimicrobial peptide in the supernatant of noninfected decidual tissues 8 hours after addition of fresh RPMI. Symbols are the same as in panel I. For all panels, error bars are standard error of the mean. **P < 0.005, ***P < 0.001 by 2-way ANOVA at the initial time points (D and H).

