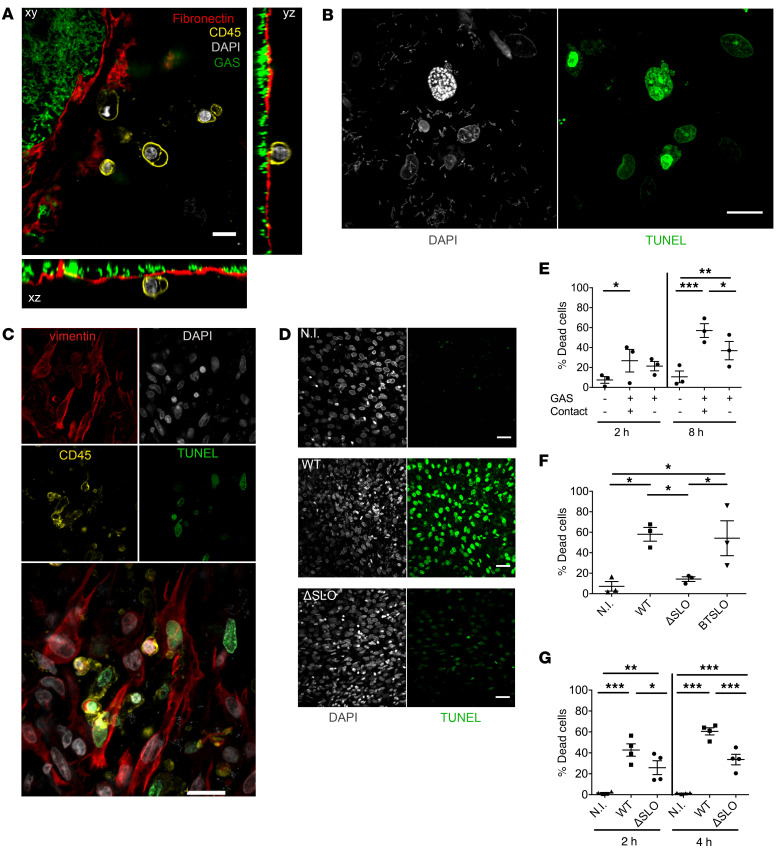
Figure 3. GAS induces stromal and immune cell death via processes involving SLO and other secreted factors.
(A) Orthogonal view of a sample 5 hpi under static conditions prestained with anti-fibronectin (red), anti-CD45 (yellow), WT-GFP bacteria (green), and DAPI (gray). Scale bar: 10 μm. Magnification: ×40. (B) Immunofluorescence of the decidua 16 hpi under static conditions. DAPI, gray; TUNEL, green. Scale bar: 10 μm. Magnification: ×63. (C) Immunofluorescence of a sample 16 hpi under static conditions. Stromal cells are vimentin+CD45– and immune cells are CD45+. Vimentin, red; DAPI, gray; CD45, yellow; TUNEL, green. Scale bar: 10 μm. Magnification: ×40. (D) Immunofluorescence of a sample 4 hpi under static conditions with the indicated strains. N.I., not infected. DAPI, gray; TUNEL, green. Scale bar: 40 μm. Magnification: ×20. (E–G) Quantification of cytotoxicity by determination of the percentage of dead cells (E) on decidua with 3 samples, in the absence, contact (+), or the presence, contact (–), of a Transwell insert at indicated times; (F) on primary decidual cells from 3 different samples with indicated strains 4 hpi; and (G) on decidua with 4 samples with indicated strains, at indicated times. *P < 0.05; **P < 0.005; ***P < 0.001 by 2-way ANOVA with Bonferroni’s post hoc test (E and G) or paired 1-way ANOVA (F).

