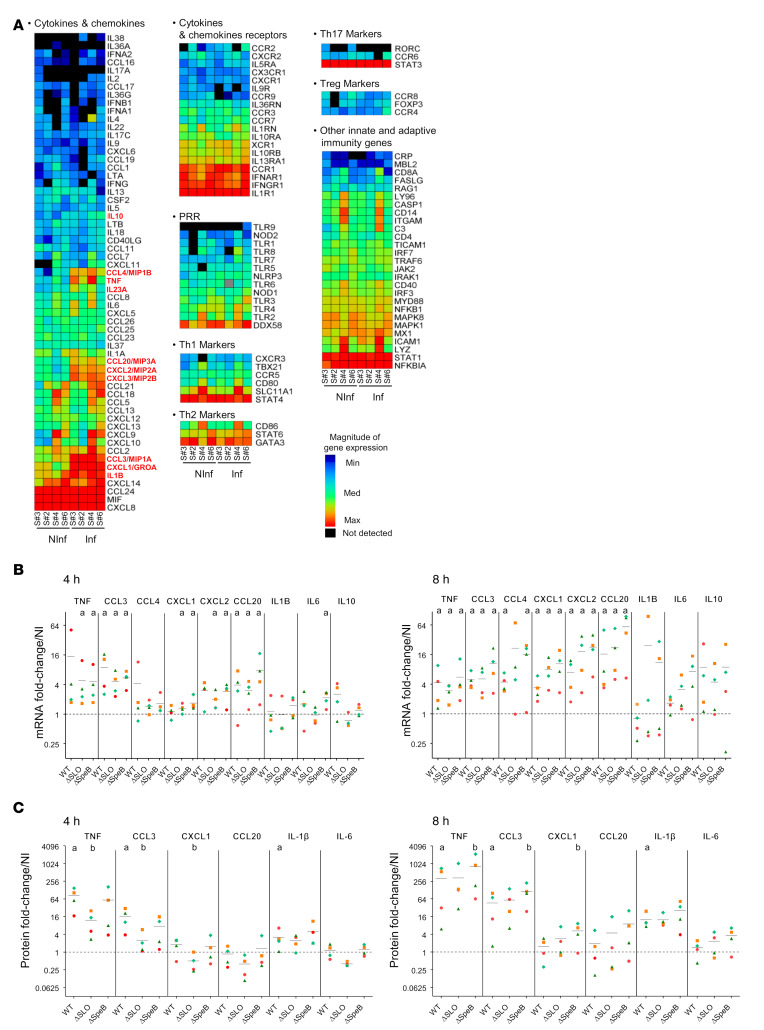
Figure 4. Host cytokine responses to GAS infection.
(A) Heatmap of the results from the qRT-PCR screening using Qiagen RT2 Profiler PCR Arrays “Inflammatory cytokines and receptors” and “Human innate & adaptive response” on 4 samples, noninfected (NInf) or infected 8 hours under static conditions with the WT strain (Inf). Cytokines significantly overexpressed in the infected compared with noninfected condition are shown in red. (B and C) Fold-change variation of the expression of the immune-related genes (B) 4 hpi (left) and 8 hpi (right) compared with the noninfected expression. aP < 0.05 compared with noninfected by 1-way Mann-Whitney U test. (C) The concentration of the indicated cytokines compared with the noninfected condition (left, 4 hpi; right, 8 hpi) from 4 different samples. aP < 0.05 compared with noninfected; bP < 0.05 compared with WT; Friedman’s test with Dunn’s post hoc multiple-comparison test. Axes in B and C are log2 transformed. Symbols are as in Figure 1I. The infecting strain, WT, ΔSLO, or ΔSpeB is indicated below the x axis. Means are indicated with black lines. Dotted lines correspond to a ratio of 1.

