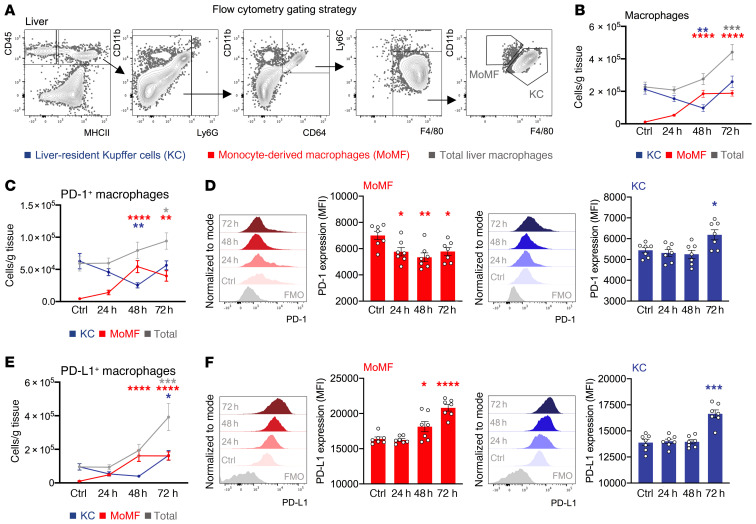
Figure 2. PD-1 and PD-L1 expression in KCs is increased during the resolution of acute liver injury.
Hepatic nonparenchymal cells were isolated from livers of baseline (control) and APAP-treated (24 h, 48 h, or 72 h) WT mice. Phenotypic characterization of liver CD45+ leukocytes was done by flow cytometry. (A) Representative flow cytometric gating strategy used to identify MoMFs and liver-resident KCs. (B) Number of MoMFs (red), KCs (blue), and total macrophages (gray) (n = 10–12 per group). (C) Number of PD-1+ MoMFs (red), PD-1+ KCs (blue), and PD-1+ total liver macrophages (gray) (n = 7 per group). (D) Representative histograms and data showing PD-1 expression (MFI) by MoMFs and KCs (n = 7 per group). (E) Number of PD-L1+ MoMFs (red), PD-L1+ KCs (blue), and PD-L1+ total liver macrophages (gray) (n = 7 per group). (F) Representative histograms and data showing PD-L1 expression (MFI) of MoMFs and KCs (n = 7 per group). Results are from 3 (B) and 2 (C–F) independent experiments. Each symbol represents an individual mouse. Data are presented as the mean ± SEM. *P < 0.05, **P < 0.01, ***P < 0.001, and ****P < 0.0001, by 1-way ANOVA (compared with control). FMO, fluorescence minus one.

