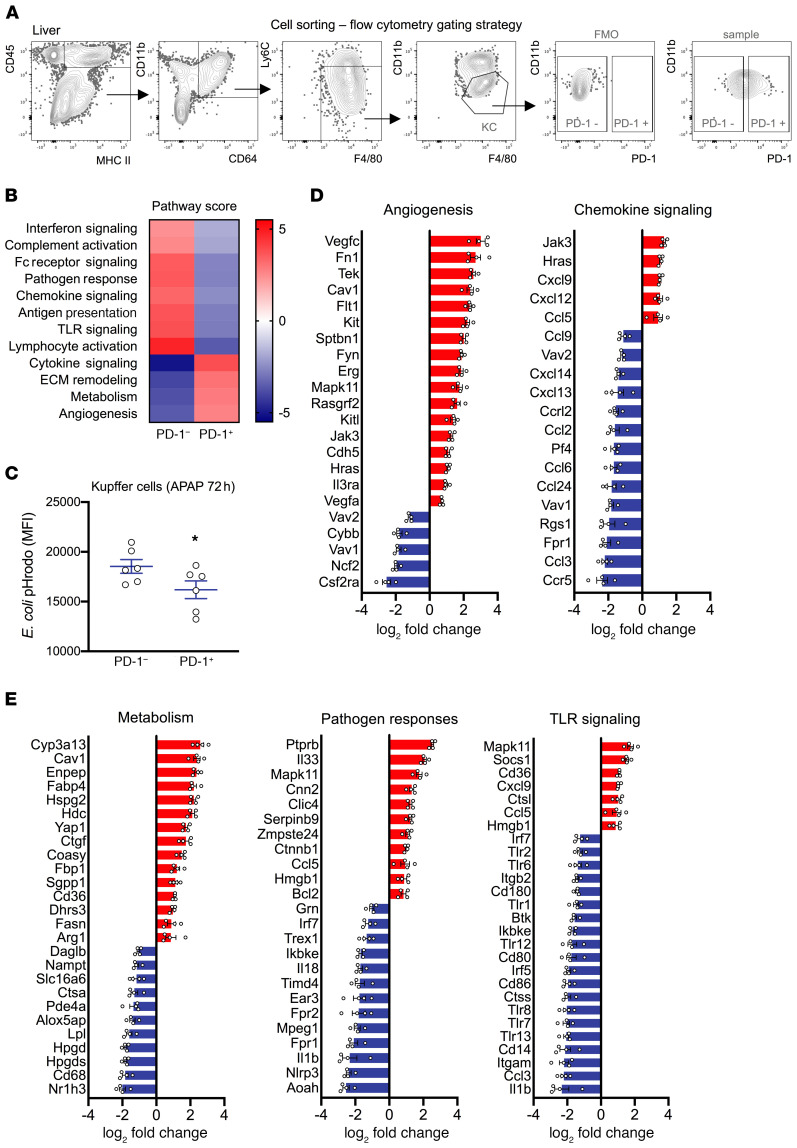
Figure 4. PD-1–expressing KCs exhibit an immune-suppressive profile during the resolution of acute liver injury.
PD-1+ and PD-1– KC subsets were sorted from livers of APAP-treated (72 h) WT mice using flow cytometry (n = 4 each). KC lysates were assessed for mRNA expression using the NanoString nCounter system (Mouse Myeloid Innate Immunity Panel). Data show comparison of PD-1+ with PD-1– cells (baseline). (A) Representative flow cytometric gating strategy used to sort the PD-1+ and PD-1– cell subsets. (B) Pathway scoring of PD-1+ and PD-1– KCs performed using nCounter Advanced Analysis. (C) Phagocytosis (uptake) of E. coli pHrodo was assessed by flow cytometry in PD-1+ and PD-1– KC subsets (APAP, 72 h) (n = 6 per group). *P < 0.05, by Wilcoxon paired test. Results are from 2 independent experiments. (D and E) Data show log2 fold change of normalized linear count data (PD-1+ subset, n = 4) for significantly differentially expressed genes (based on nCounter Advanced Analysis) in various pathways. A Benjamini-Hochberg P value adjustment was applied. Statistical significance was set at P < 0.05 and a 2-fold linear change. Data are presented as the mean ± SEM.

