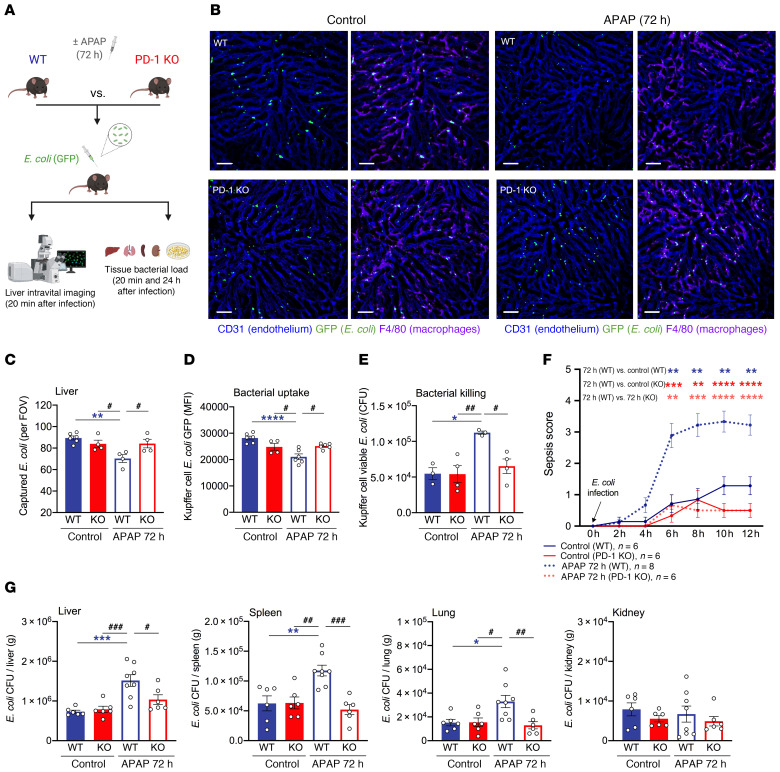
Figure 5. PD-1 deficiency improves KC bacterial clearance and confers protection from sepsis in mice with acute liver injury.
Baseline (control) and APAP-treated (72 h) WT and PD-1–deficient (PD-1 KO) mice were intravenously challenged with E. coli. (A) Schematic of experimental E. coli challenge. (B) Representative intravital liver images (20 min after infection). Macrophages and endothelial cells were stained with fluorescently labeled anti-F4/80 (purple) and anti-CD31 (blue) antibodies, respectively; GFP+ E. coli (green). Scale bars: 50 μm. (C) Intravital liver imaging analysis showing the amount of macrophage-captured E. coli per FOV (n = 4–6 per group). (D) KC E. coli uptake measured by flow cytometry (n = 4–6 per group). (E) Sorted KCs from control or APAP-treated (72 h) WT and PD-1–/– mice were in vitro challenged with E. coli (1:100 ratio, 60 min). In vitro bacterial killing of KC phagocytosed E. coli was evaluated by measuring viable E. coli CFU recovered from KC lysates (n = 3–4 per group). (F) Mouse sepsis scores over time following E. coli infection (n = 6–8 per group). (G) CFU analysis of bacterial burden in the liver, spleen, lungs, and kidneys 24 hours after infection (n = 6–8 per group). Results are from 3 (B–D, F, and G) and 2 (E) independent experiments. Each symbol represents an individual mouse. Data are presented as the mean ± SEM. * or #P < 0.05, ** or ##P < 0.01, *** or ###P < 0.001, ****P < 0.0001, by 1-way ANOVA (C–E and G) or 2-way, repeated-measures ANOVA (F).

