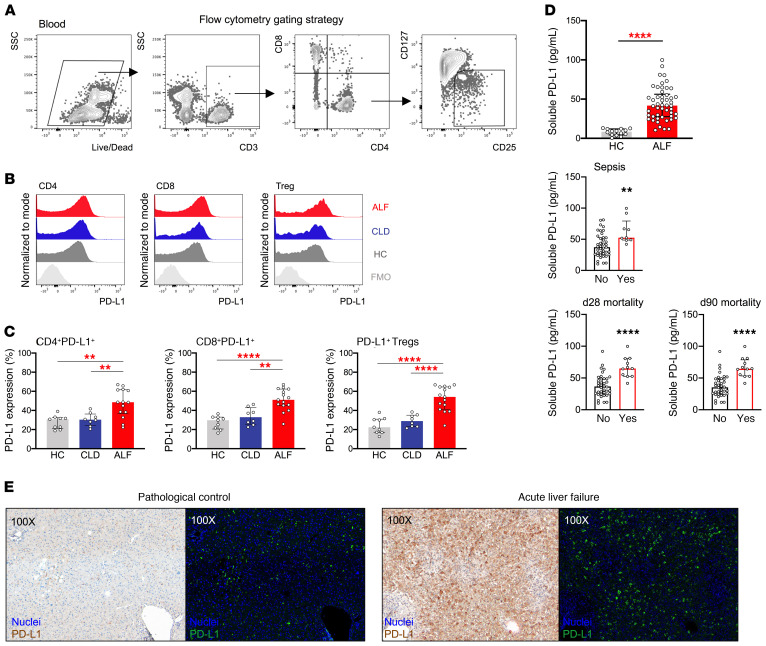
Figure 7. Lymphocyte PD-L1 expression and sPD-L1 plasma levels are increased in patients with ALF.
Phenotypic characterization of lymphocytes was performed by flow cytometry in PBMCs from HCs (n = 9) and patients with CLD (n = 8) or ALF (n = 15). (A) Representative flow cytometric gating strategy used to identify CD4+ T cells, CD8+ T cells, and Tregs. (B and C) Representative histograms and data showing PD-L1 expression (percentage) in CD4+ T cells, CD8+ T cells, and Tregs. (D) Dot plots show plasma sPD-L1 levels as determined by ELISA in HCs (n = 8) and patients with ALF (n = 50) and plasma sPD-L1 levels in patients with ALF based on development of sepsis (no: n = 41; yes: n = 9), day-28 mortality (no: n = 38; yes: n = 11), or day-90 mortality (no: n = 36; yes: n = 12). (E) Representative IHC images of PD-L1 staining in pathological control and APAP-induced ALF liver tissues analyzed using Nuance multispectral imaging technology. Left panels: RGB images show nuclei (blue) and PD-L1 (brown) staining. Original magnification, ×100. Right panels: Pseudofluorescence images show nuclei (blue) and PD-L1 (green) staining. Original magnification, ×100. Data are presented as the median with the IQR. **P < 0.01 and ****P < 0.0001, by Mann-Whitney U test.

