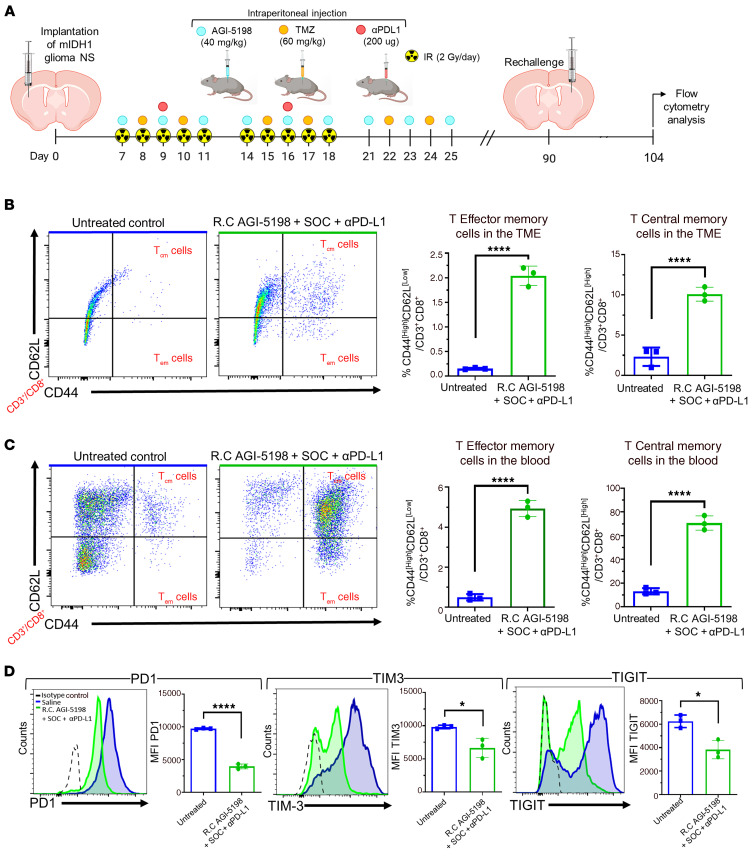
Figure 11. Inhibition of IDH1-R132H in combination with SOC and αPD-L1 induces CD8+ T cell memory responses and lowers T cell exhaustion within the TME of mIDH1 glioma–bearing mice.
(A) Experimental design to assess memory T cell response in mIDH1 glioma–bearing mice treated with AGI5198+SOC+αPDL1. (B) The percentage of Tcm cells (CD62L+/CD44+) and Tem cells (CD62L–/CD44) within the CD45+/CD3+ cell population in the TME of untreated control and AGI-5198+SOC+αPD-L1–treated mice was assessed at 14 dpi after mIDH1 glioma rechallenge (R.C). Representative flow plots for each group are displayed. ****P < 0.0001, unpaired, 2-tailed t test. Bars represent mean ± SEM (n = 3 biological replicates). (C) The percentage of Tcm cells (CD62L+/CD44+) and Tem cells (CD62L–/CD44) within the CD45+/CD3+ cell population in the circulation of untreated control and AGI-5198+SOC+αPD-L1–treated mice was assessed at 14 dpi after mIDH1 glioma rechallenge. Representative flow plots for each group are displayed. ****P < 0.0001, unpaired, 2-tailed t test. Bars represent mean ± SEM (n = 3 biological replicates). (D) CD8+ T cell exhaustion in the TME of mIDH1 glioma–bearing mice of untreated control and AGI-5198+SOC+αPD-L1–treated mice was assessed at 14 days after tumor rechallenge, by assessing the expression levels of PD-1, TIM-3, and TIGIT markers. Representative histograms display each marker’s expression levels (black, isotype control; blue, saline; green, AGI-5198+SOC+αPD-L1). *P < 0.05; ****P < 0.0001, unpaired, 2-tailed t test. Bars represent mean ± SEM (n = 3 biological replicates).

