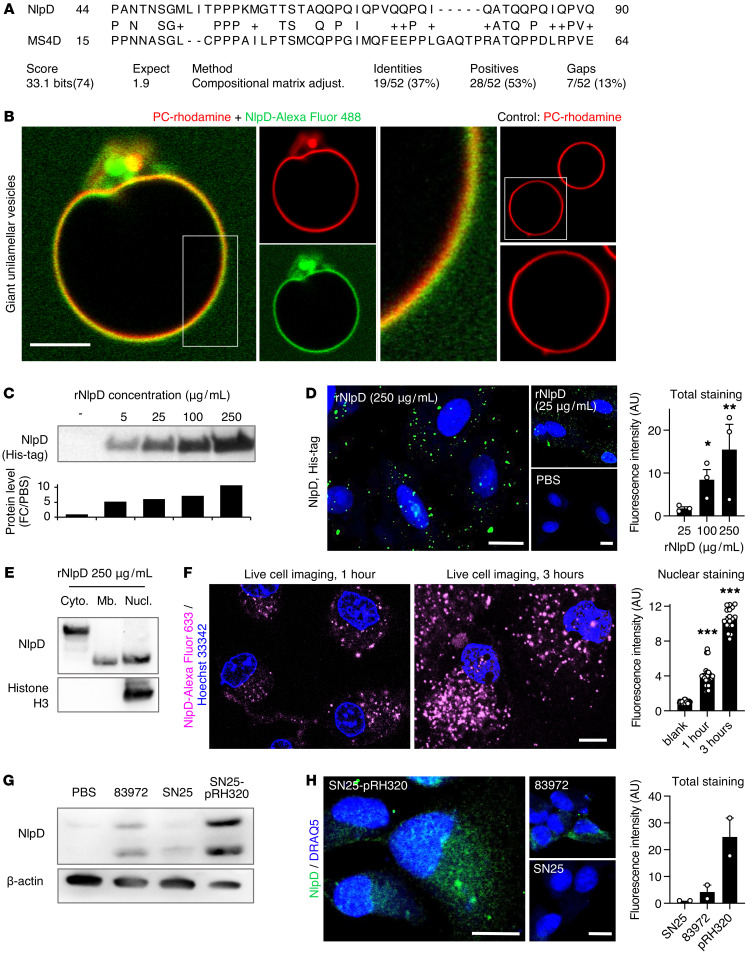
Figure 6. Membrane interaction and transfer of rNlpD into host cells.
(A) Sequence alignment of NlpD and the human MS4D protein. (B) Membrane interaction of rNlpD (Alexa Fluor 488, green) with giant unilamellar vesicles, labeled with rhodamine (red). Membrane colocalization (yellow) was detected in 6 of 13 vesicles. PC, phosphatidyl choline. (C–F) NlpD was detected in lysates and was internalized by human kidney cells exposed to rNlpD-His protein (0–250 μg/mL). (C) Western blot stained with anti-His antibodies. (D) Confocal imaging of cells stained with anti-His antibodies. Nuclei were counterstained with DRAQ5. Data are presented as mean ± SEM (n = 3 experiments). (E) NlpD was detected in the cytoplasm, membrane, and nuclei of treated cells. Western blot of cellular fractions stained with anti-NlpD antibodies. (F) NlpD internalization and nuclear translocation in cells exposed to Alexa Fluor 633–labeled rNlpD (magenta, 250 μg/mL) for 1 or 3 hours. Live-cell imaging: the nuclear plane of each image is shown. NlpD levels were quantified from 3 Z-stacks surrounding the nuclear plane. Nuclei were counterstained with Hoechst 33342. Data are presented as mean ± SEM (n = 18–24 cells). (G and H) Detection of NlpD in human kidney cells after infection with E. coli 83972 or the nlpD-reconstituted strain E. coli SN25-pRH320. (G) Western blot of whole cell lysates stained with anti-NlpD antibodies. Data are representative of 2 independent experiments. (H) NlpD uptake after infection. Staining was quantified by confocal imaging using anti-NlpD antibodies. E. coli SN25 served as a negative control. Scale bars: 10 μm. Data are presented as mean ± range (n = 2 experiments). *P < 0.05, **P < 0.01, ***P < 0.001 compared with 25 μg/mL (D) or compared with blank (F) by Kruskal-Wallis test with Dunn’s multiple-comparison test.

