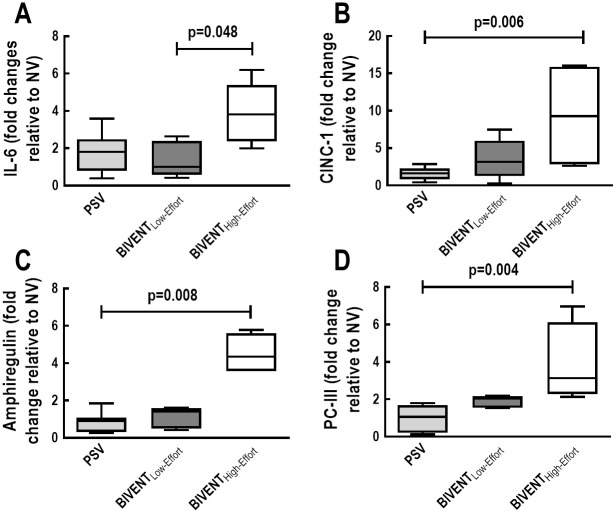
Fig 6. Real-time polymerase chain reaction analysis of biological markers measured in lung tissue for inflammation (A: interleukin [IL]-6; B: cytokine-induced neutrophil chemoattractant [CINC]-1), alveolar stretch (C: amphiregulin), and fibrogenesis (D: procollagen [PC]-III).
Box plots represent the median and interquartile range. Relative gene expression was calculated as a ratio of the average gene expression levels compared with the reference gene (36B4) and expressed as fold change relative to respective NV. No difference was observed between PSV vs BIVENTLow-Effort regarding IL-6, CINC-1, amphiregulin, or PC-III expressions (p = 0.996, p = 0.221, p = 0.999, p = 0.255, respectively). Comparisons were done by the Kruskal–Wallis test followed by Dunn’s multiple comparisons (p<0.05).

