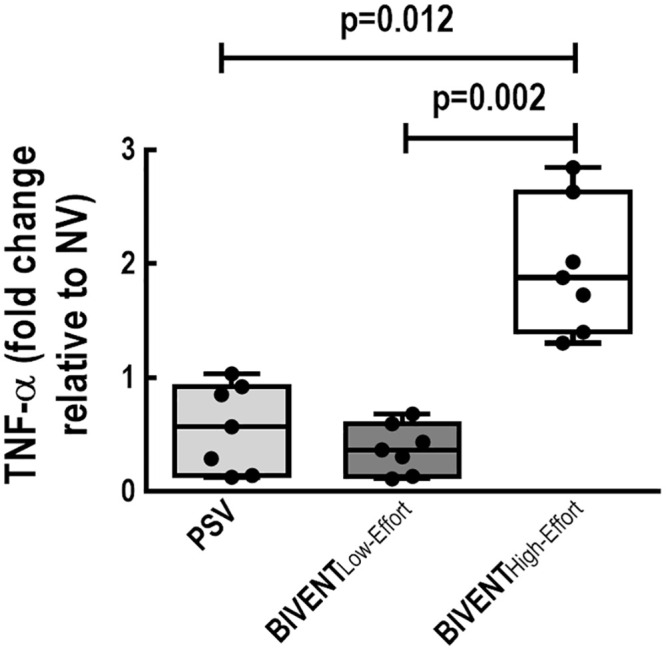
Fig 9. Real-time polymerase chain reaction analysis of tumour necrosis factor (TNF)-α in diaphragm tissue.

Box plots represent the median and interquartile range. Relative gene expression was calculated as a ratio of the average gene expression levels compared with the reference gene (36B4) and expressed as fold change relative to respective NV. No difference was observed between PSV vs BIVENTLow-Effort (p = 0.999) Comparisons were done by the Kruskal–Wallis test followed by Dunn’s multiple comparisons (p<0.05).
