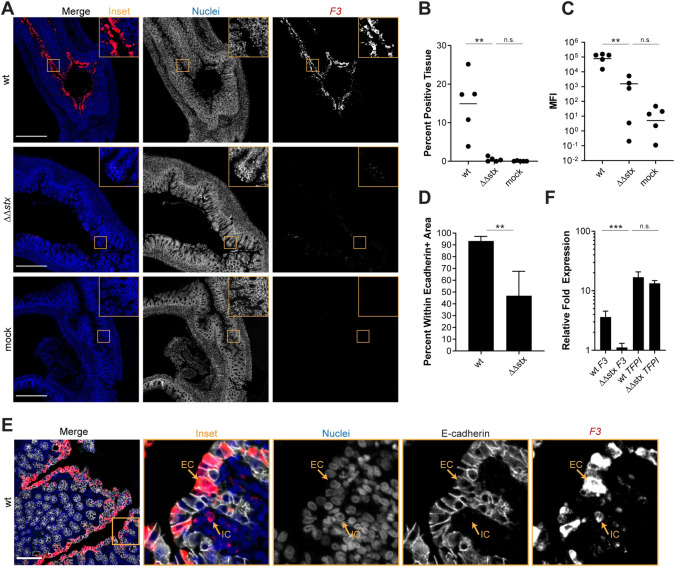
Fig 4. Expression of F3 in epithelial cells is much greater in animals infected with WT vs ΔΔstx EHEC.
(A) Micrographs of colon sections from rabbits inoculated with WT EHEC, ΔΔstx EHEC, or PBS (mock) stained with a probe to rabbit F3 mRNA (red) and DAPI (blue). Scale bar is 500 μM. (B) Percentage of tissue section with F3 signal from individual colons. Distributions compared using Mann-Whitney U test, p<0.01 (**), n.s. indicates not significant. (C) Mean fluorescent intensity (MFI) from individual colons plotted with mean. Distributions compared using Mann-Whitney U test, p<0.01 (**), n.s. indicates not significant. (D) Percent F3 signal within E-cadherin positive cells. Distributions compared using the Mann-Whitney U test, p<0.05 (*). (E) Sections stained with a probe to rabbit F3 mRNA (red), DAPI (blue), and anti-E-cadherin antibody (white). Scale bar is 500 μM. Example immune cell (IC) and epithelial cell (EC) are indicated. (F) Normalized expression of F3 and TFPI in HT29 cells infected with WT EHEC, ΔΔstx EHEC, or PBS. Expression levels compared with a Students two-tailed t-test, p<0.001 (***), n.s. indicates not significant.

