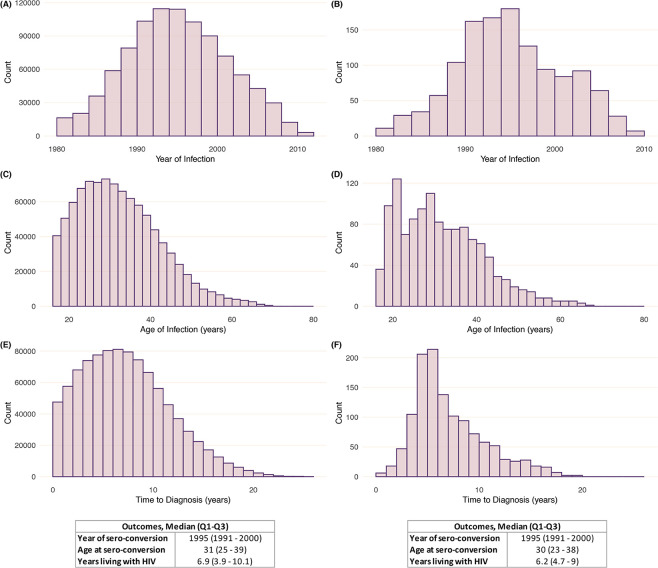
Fig 3.
Estimates for the year of seroconversion (A-B), age at seroconversion (C-D), and duration of infection from HIV seroconversion until diagnosis (E-F). Note: For each outcome, the counts on the left are for the estimated values based on each CD4 value in the normal range for each individual (i.e., a maximum of 1000 observations per individual). For each outcome, the counts on the right are for the estimated individual-level values summarized as the median and quartiles of the corresponding distribution on the left (i.e., a maximum of 1 observation per individual).

