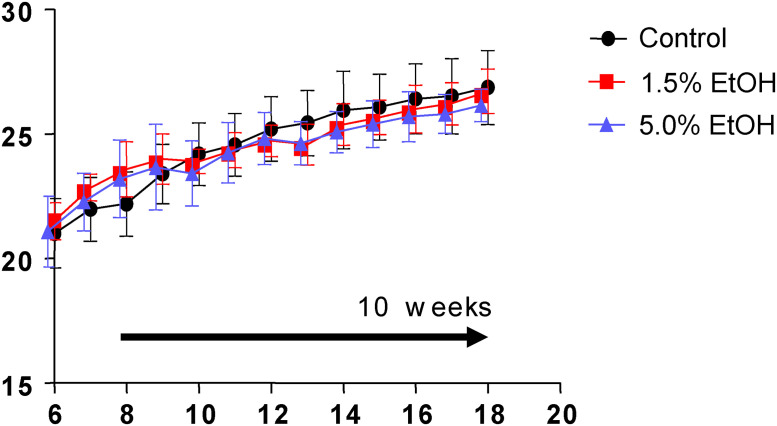
Fig 1. Course of body weight changes during the experiment.
Eight-week-old mice were orally gavaged daily with 1.0 mL/day of water (control, black circles), 1.0 mL/day of 1.5% (v/v) ethanol (the 1.5%-ethanol group, red squares), and 1.0 mL/day of 5.0% (v/v) ethanol (the 5.0%-ethanol group, blue triangles) for 10 weeks (horizontal arrow). Body weights were measured every week. The data are expressed as means ±SD (n = 7 to 8) for each group and assessed using ANOVA with the Tukey-Kramer test.

