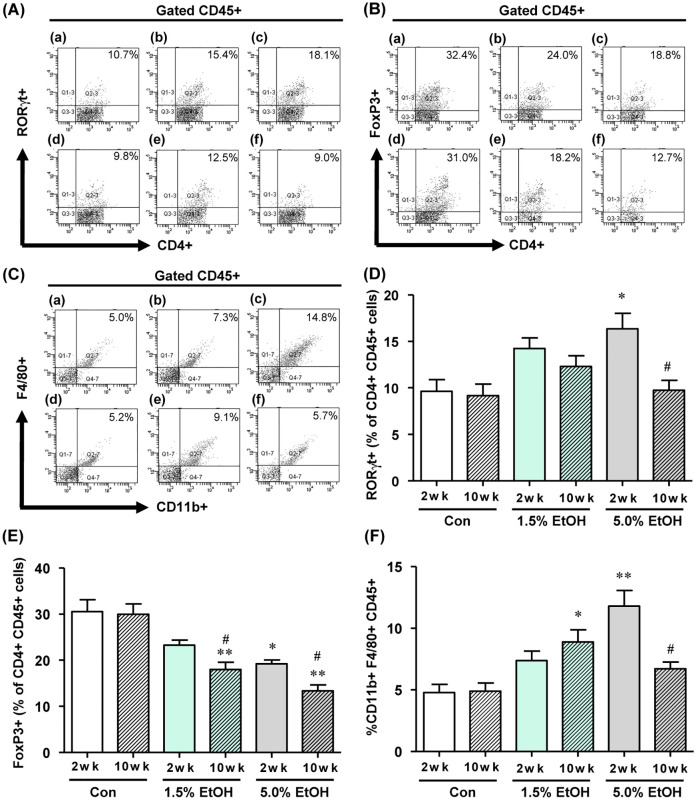
Fig 5. Effects of chronic oral administration of ethanol on the colonic population of inflammation-associated immune cells in mice as analyzed by flow cytometry.
(A) The proportion of CD4+ CD45+ RORγt+ T cells, (B) CD4+ CD45+ Fox3+ T cells, (C) CD11b+ CD45+ F4/80+ macrophages detected by flow cytometry: (a) 2-wk Con, (b) 2-wk 1.5% EtOH, (c) 2-wk 5.0% EtOH, (d) 10-wk Con, (e) 10-wk 1.5% EtOH, (f) 10-wk 5.0% EtOH. The quantitative analyses data are shown: (D) CD4+ CD45+ RORγt+ T cells, (E) CD4+ CD45+ Fox3+ T cells, (F) CD11b+ CD45+ F4/80+ macrophages by flow cytometry. For (D), (E) and (F), the results are expressed as means ±SD (n = 4). *p<0.05, **p<0.01 and versus 2 wk control, as assessed by ANOVA with the Tukey-Kramer test. #p<0.05 for 2 wk versus 10 wk with the same ethanol dosage, as assessed by the paired t-test. For abbreviations for ethanol-administration conditions, see the legend to Fig 2. For experimental details, see Materials and methods.

