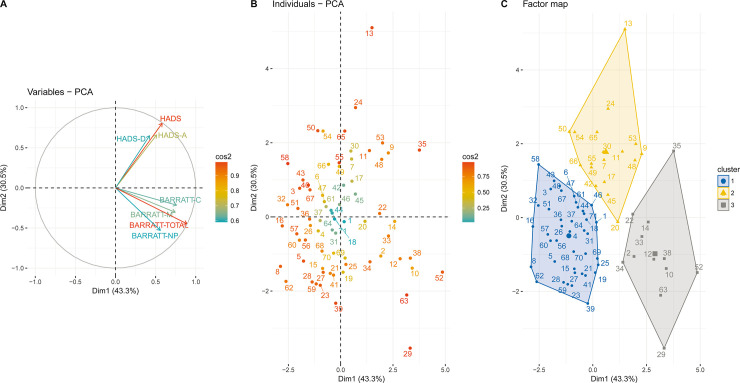
Fig 1. Principal Component Analysis (PCA) of the HADS and BIS-10 scores of 71 LCH patients.
Loading plots of the first two components are shown: the first component is on the horizontal axis, and the second component is on the vertical axis. (A) Plots of the HADS and BIS-10 variables. (B) Plots of patients. (C) Clusters identified among the study population through hierarchical clustering analysis.

