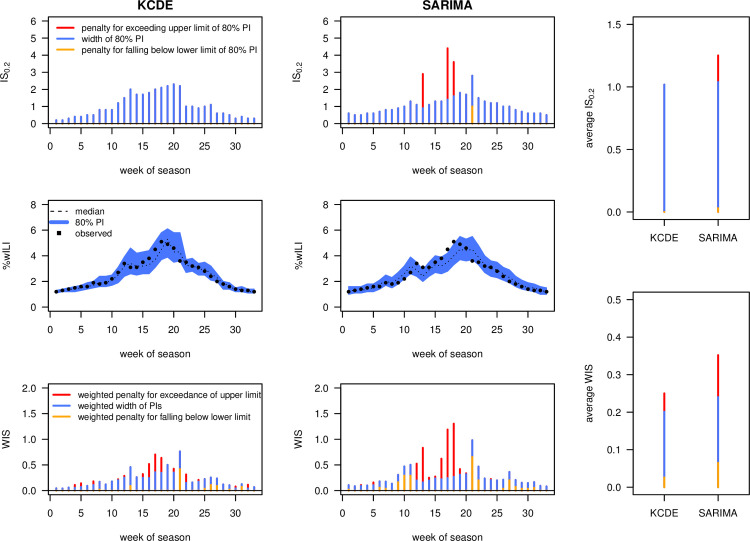
Fig 4. Interval and weighted interval score applied to FluSight forecasts.
Comparison of 1-week-ahead forecasts by KCDE and SARIMA over the course of the 2016/2017 FluSight season. The top row shows the interval score with α = 0.2, the bottom row the weighted interval score with α1 = 0.02, α2 = 0.05, α3 = 0.1,…, α11 = 0.9. The panels at the right show mean scores over the course of the season. All bars are decomposed into the contribution of interval widths (i.e., a measure of sharpness; blue) and penalties for over- and underprediction (orange and red, respectively). Note that the absolute values of the 2 scores are not directly comparable as the WIS involves rescaling of the included interval scores.

