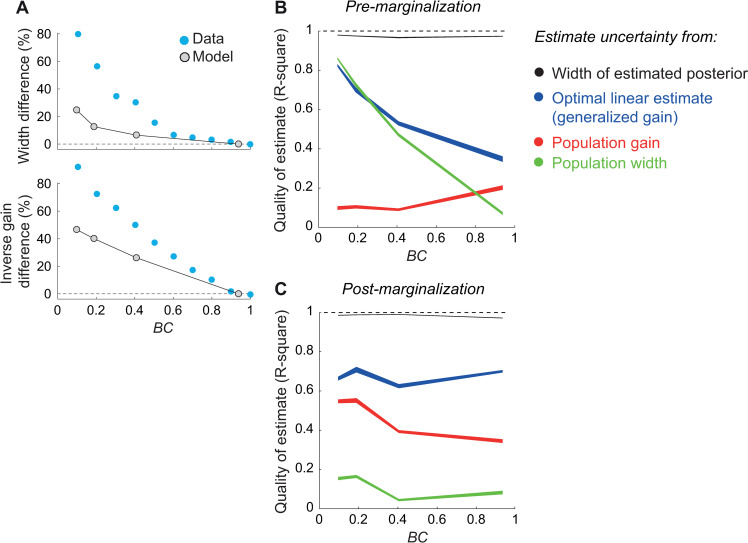
Fig 5. Uncertainty estimation quality from IC and OT neuronal activity.
(A) Tuning cuve width and inverse gain as a function of BC, expressed as a percent change from the value measured at the highest BC. Gray symbols: models. Blue: data from Cazettes et al. [14]. (B) Performance of different estimators as a function of BC. The estimators used IC neuronal activity to estimate the uncertainty of the pre-marginalization ideal observer. Quality was measured by the cross-validated R2 between the ideal observer’s posterior log-variance and estimated log-variance. Black: uncertainty of the reconstructed posterior. Blue: uncertainty estimated by a linear fit to single neuron activity. Red: uncertainty estimated by a linear fit to the total neuronal activity. Green: uncertainty estimated by a linear fit of the width of population activity. Line width represents 95% c.i. (C) Same as (B), but using OT neuronal activity to estimate the uncertainty of the post-marginalization ideal observer. In this case performance is still split by BC, but the linear fits were performed by combining trials across all BC (i.e. the estimators, as well as the ideal observer, had no knowledge of the true BC value).

