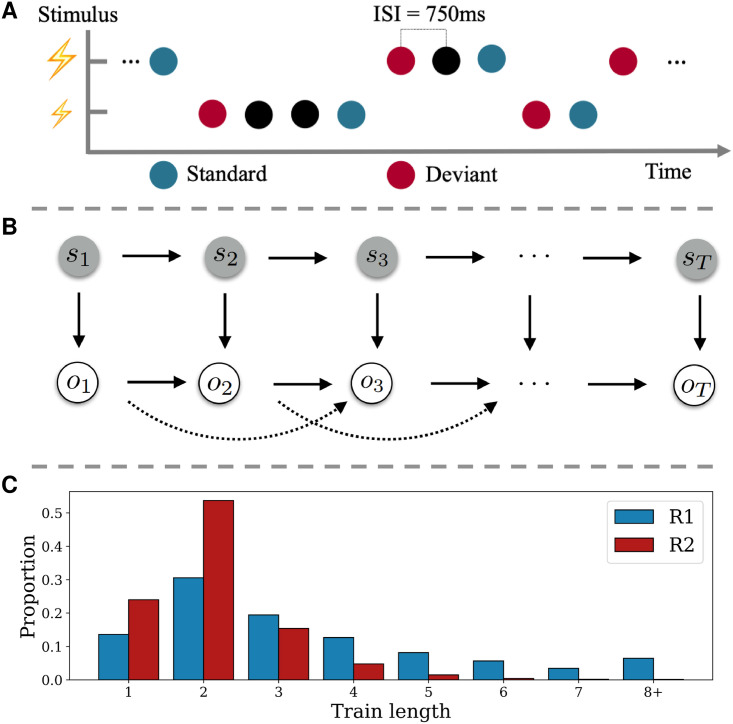
Fig 1. Experimental design and stimulus generation.
A) Presentation of experimental stimuli using a roving-stimulus paradigm. Stimuli with two different intensities are presented. Their role as standard or deviant depends on their respective position within the presentation sequence. B) Graphical model of data-generating process. Upper row depicts the evolution of states st over time according to a Markov chain. The states emit observations ot (lower row), which themselves feature second order dependencies on the observation level. C) Average proportion of resulting stimuli train lengths. Higher proportion of shorter trains for the fast switching regime (R2; red) and more distributed proportion across higher train lengths for the slow switching regime (R1; blue).

