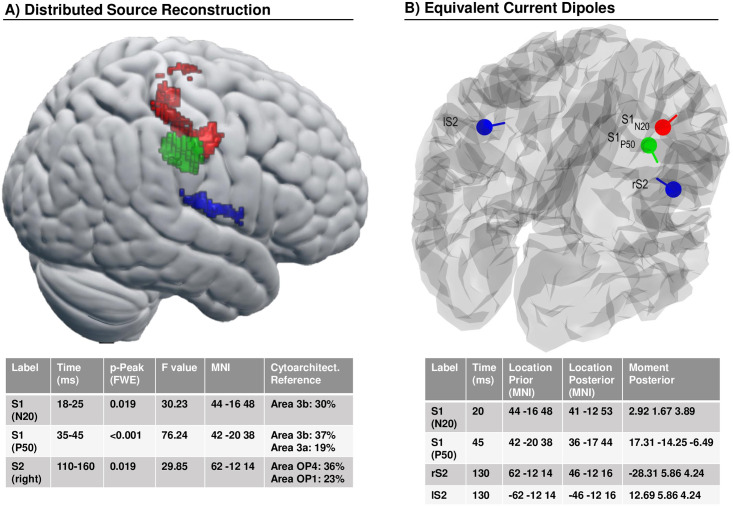
Fig 8. EEG source model.
(A) Statistical results of distributed source reconstruction. Red: 18-25ms, Green: 35-45ms, Blue: 110-160ms. Below: Table with corresponding detailed data of the clusters. (B) Location and orientation of fitted equivalent current dipoles. Red: S1 (N20), Green: S1 (P50), Blue: bilateral S2. Below: Table with their corresponding values.

