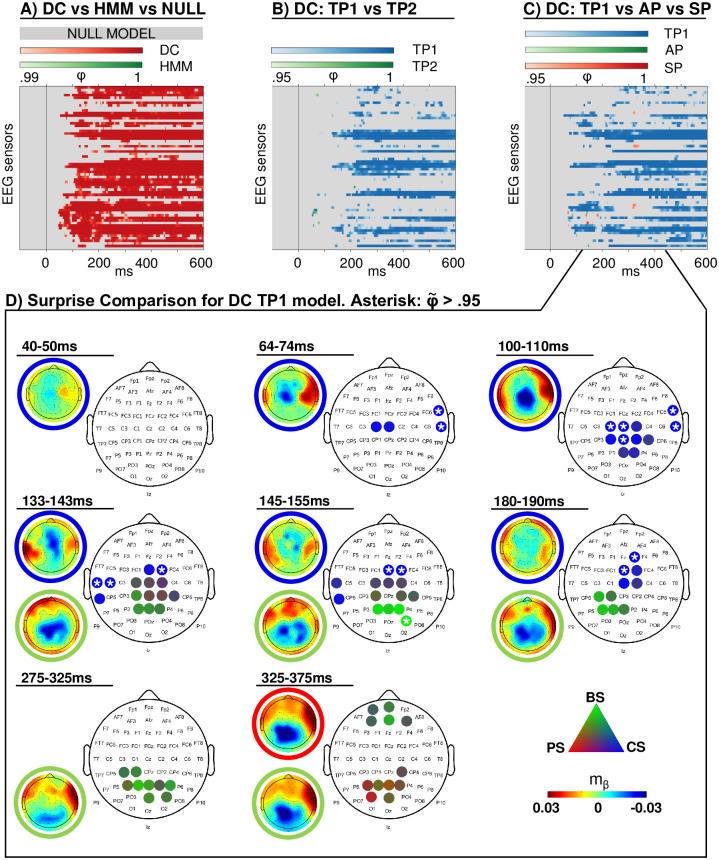
Fig 10. Modeling results.
Exceedance probabilities (φ) resulting from the random-effects family-wise model comparison. (A) Dirichlet-Categorical (DC) model, Hidden Markov Model (HMM) and null model family comparison, thresholded at φ > 0.99 and applied for data reduction at all further levels. (B) Family comparison within the winning DC family, thresholded at φ > 0.95: first and second order transition probability models (TP1, TP2). (C) Family comparison within the winning DC family, thresholded at φ > 0.95: first order transition probability (TP1), alternation probability (AP) and stimulus probability (SP) models and applied at the final level. (D) Unthresholded protected exceedance probabilities () resulting from model comparison of surprise models within the winning DC TP1 family: Large discrete topographies show the electrode clusters of predictive surprise (PS) in red, Bayesian surprise (BS) in green and confidence-corrected surprise (CS) in blue. White asterisks indicate of single electrodes. Small continuous topographies display the converged variational expectation parameter mβ. This parameter may be interpreted as a β weight in regression, indicating the strength and directionality of the weight on the model regressor that maximizes the regressor’s fit to the EEG data (see S2 Appendix).

