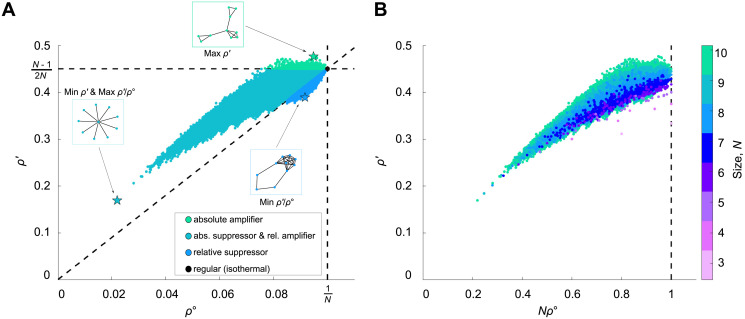
Fig 2. Exhaustive analysis of fixation probabilities under weak selection for small graphs.
(A) The values of ρ∘ and ρ′ are plotted for all 11,716,571 connected unweighted graphs of size 10. Colors correspond to the classification of graphs as shown in Fig 1B. (B) Scatter plot of ρ′ versus Nρ∘ for all graphs up to size 10. Note that Nρ∘ ≤ 1 for all graphs, with equality if only if the graph is isothermal (or regular, in the context of unweighted graphs).

