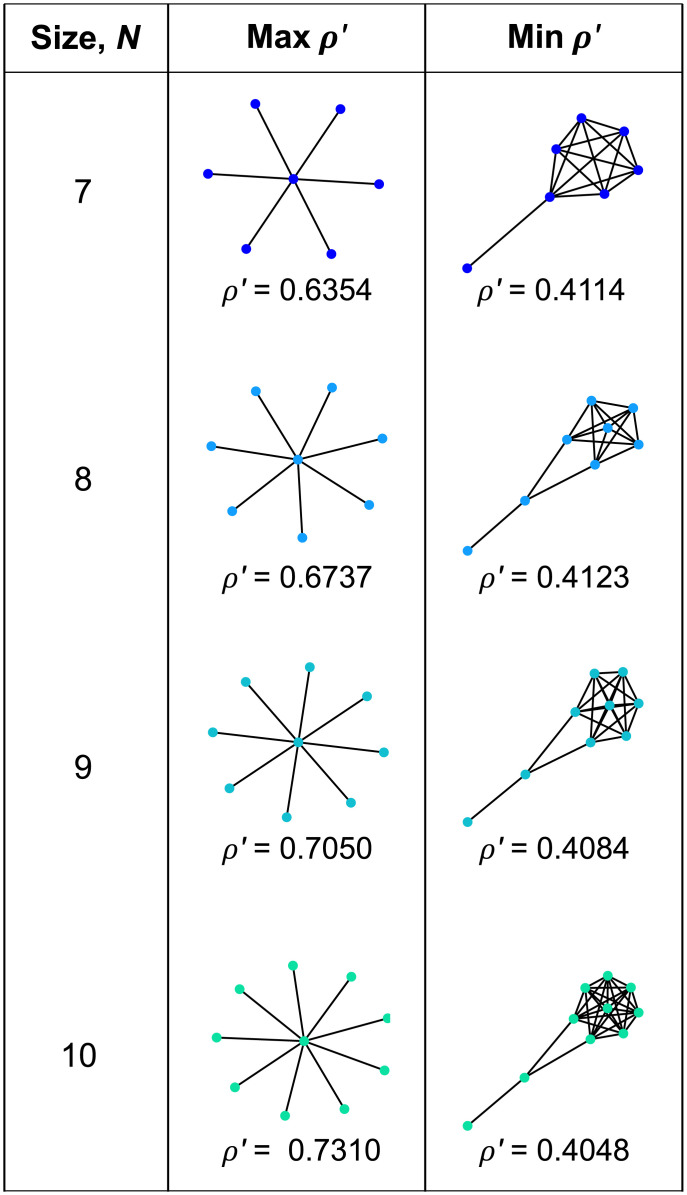
Fig 4. Small graphs with extreme effects for uniform initialization.
The graphs with the largest or smallest values of ρ′ are shown for graphs of size 7 to 10. (Only ρ′ is shown because, for uniform initialization, ρ∘ = 1/N for every graph.) Star graphs have the largest ρ′, while the smallest ρ′ values appear for graphs with a highly connected component linked to a tail.

