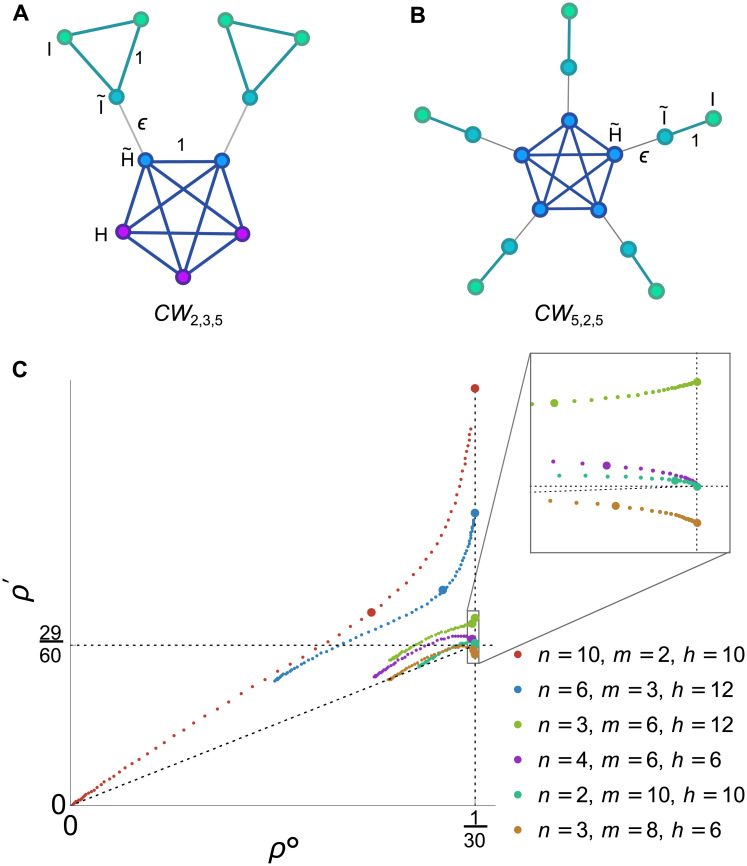
Fig 9. Cartwheel.
(A) The Cartwheel graph CWn,m,h contains n islands of m vertices each and h ≥ n hub vertices. Each island is connected to a distinct hub vertex by an edge of weight ϵ; vertices within the hub and within each island are joined by edges of weight 1. (B) The special case n = h and m = 2 has a “spider” structure; this graph has the largest ρ′ in the ϵ → 0 limit. (C) Plot of ρ∘ vs ρ′ for various Cartwheel graphs of size N = 30, with temperature initialization. Points are shown for each ϵ = 2k, where k varies from −5 to 9 in increments of 0.2. Larger points correspond to ϵ = 1 and the ϵ → 0 limit, as derived in Eq (19). Note that limϵ→0 ρ∘ = 1/N for all Cartwheel graphs. CW10,2,10 (the “spider” case) has by far the largest ρ′ in the ϵ → 0 limit; it also has the largest ρ/ρ∘, for all ϵ, among the graphs displayed. However, CW6,3,12 has the largest ρ′ for ϵ = 1 among Cartwheels of size 30. CW4,6,6 and CW2,10,10 both have h = m and therefore have the same fixation probability as a well-mixed population in the ϵ → 0 limit, according to Eq (18). CW3,8,6 has h < m and is therefore a suppressor of weak selection in the ϵ → 0 limit.

