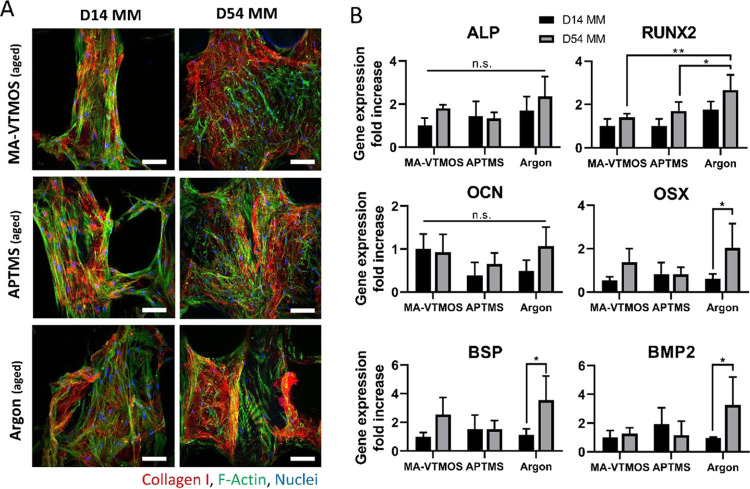
Figure 8.
Evaluation of the osteogenic differentiation potential of hMSCs seeded on aged plasma-treated scaffolds. (A) Representative confocal microscopy images of hMSCs (F-actin, green) on top of scaffold filaments after 14 and 54 days of culture (7 and 47 days in MM, respectively) and stained for the relevant osteogenic marker COL1 (red). Scale bars 100 μm. (B) Gene expression of hMSCs after 14 and 54 days of culture (7 and 47 days in MM, respectively) comparing the three different plasma treatments. ALP, RUNX2, OCN, OSX, BSP, and BMP2 fold-change expression values relative to MA-VTMOS day 14. Data presented as average ± s.d. and statistical significance performed using two-way ANOVA with Tukey’s multiple comparison test (n.s. p > 0.05; *p < 0.05; **p < 0.01).

