
Figure 3: Acute in vivo performance and pre-/post- implantation EIS of porous and flat platinum electrodes.
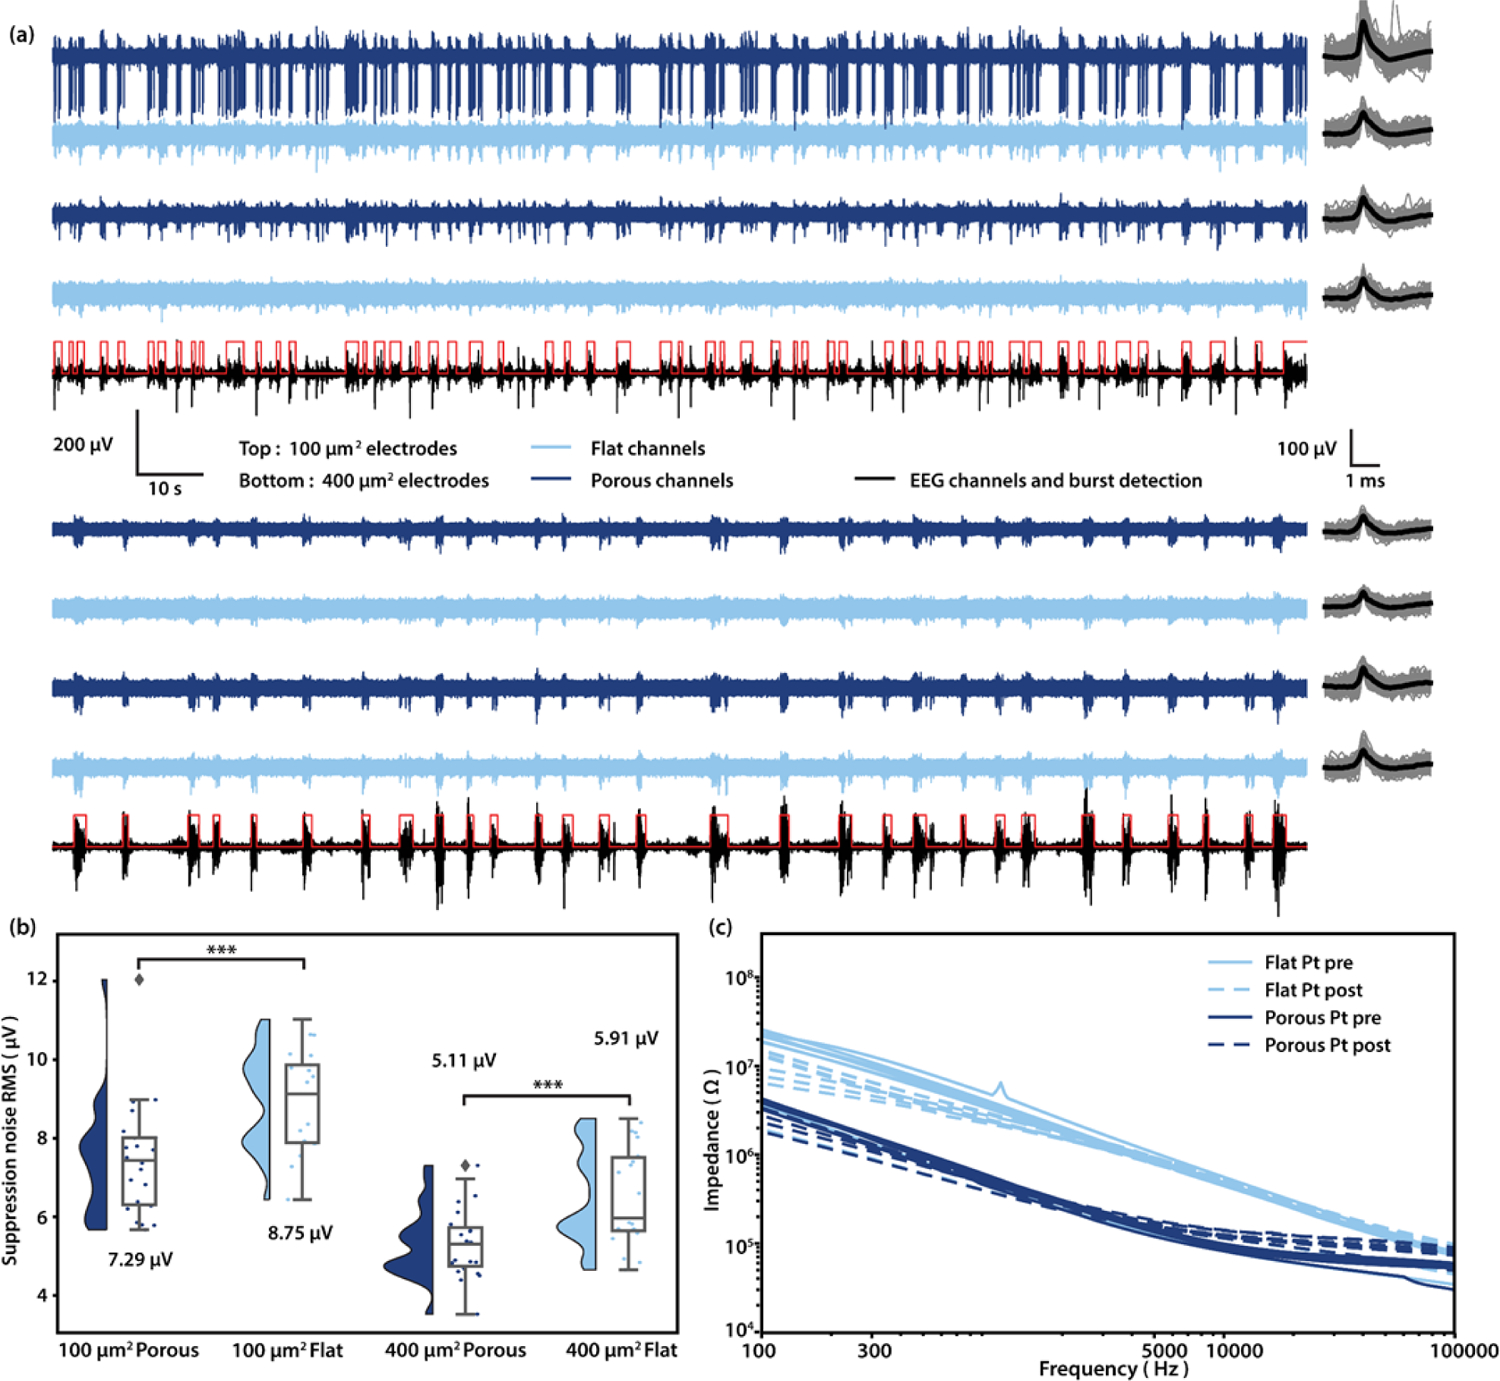
A Recorded traces and mean waveform of 100 µm2 (Top) porous (Dark blue) and flat electrodes (Light blue), and 400 µm2 (Bottom) porous (Dark blue) and flat electrodes (Light blue). Spike waveforms (Gray) are extracted and plotted on the right, mean waveforms are shown in black. The traces in black are EEG channels, which are used to determine burst (Highlighted in red) and suppression periods. B Noise RMS during suppression of 100 µm2 porous and flat electrodes, and 400 µm2 porous and flat electrodes, respectively. Numbers shown are medians. (N = 22, 21, 23, 22. ***p < 0.001, ***p < 0.001; One-sided Mann–Whitney U test). C Pre- and post- implantation EIS of all 16 channels in a 400 µm2 probe.