
Figure 3.
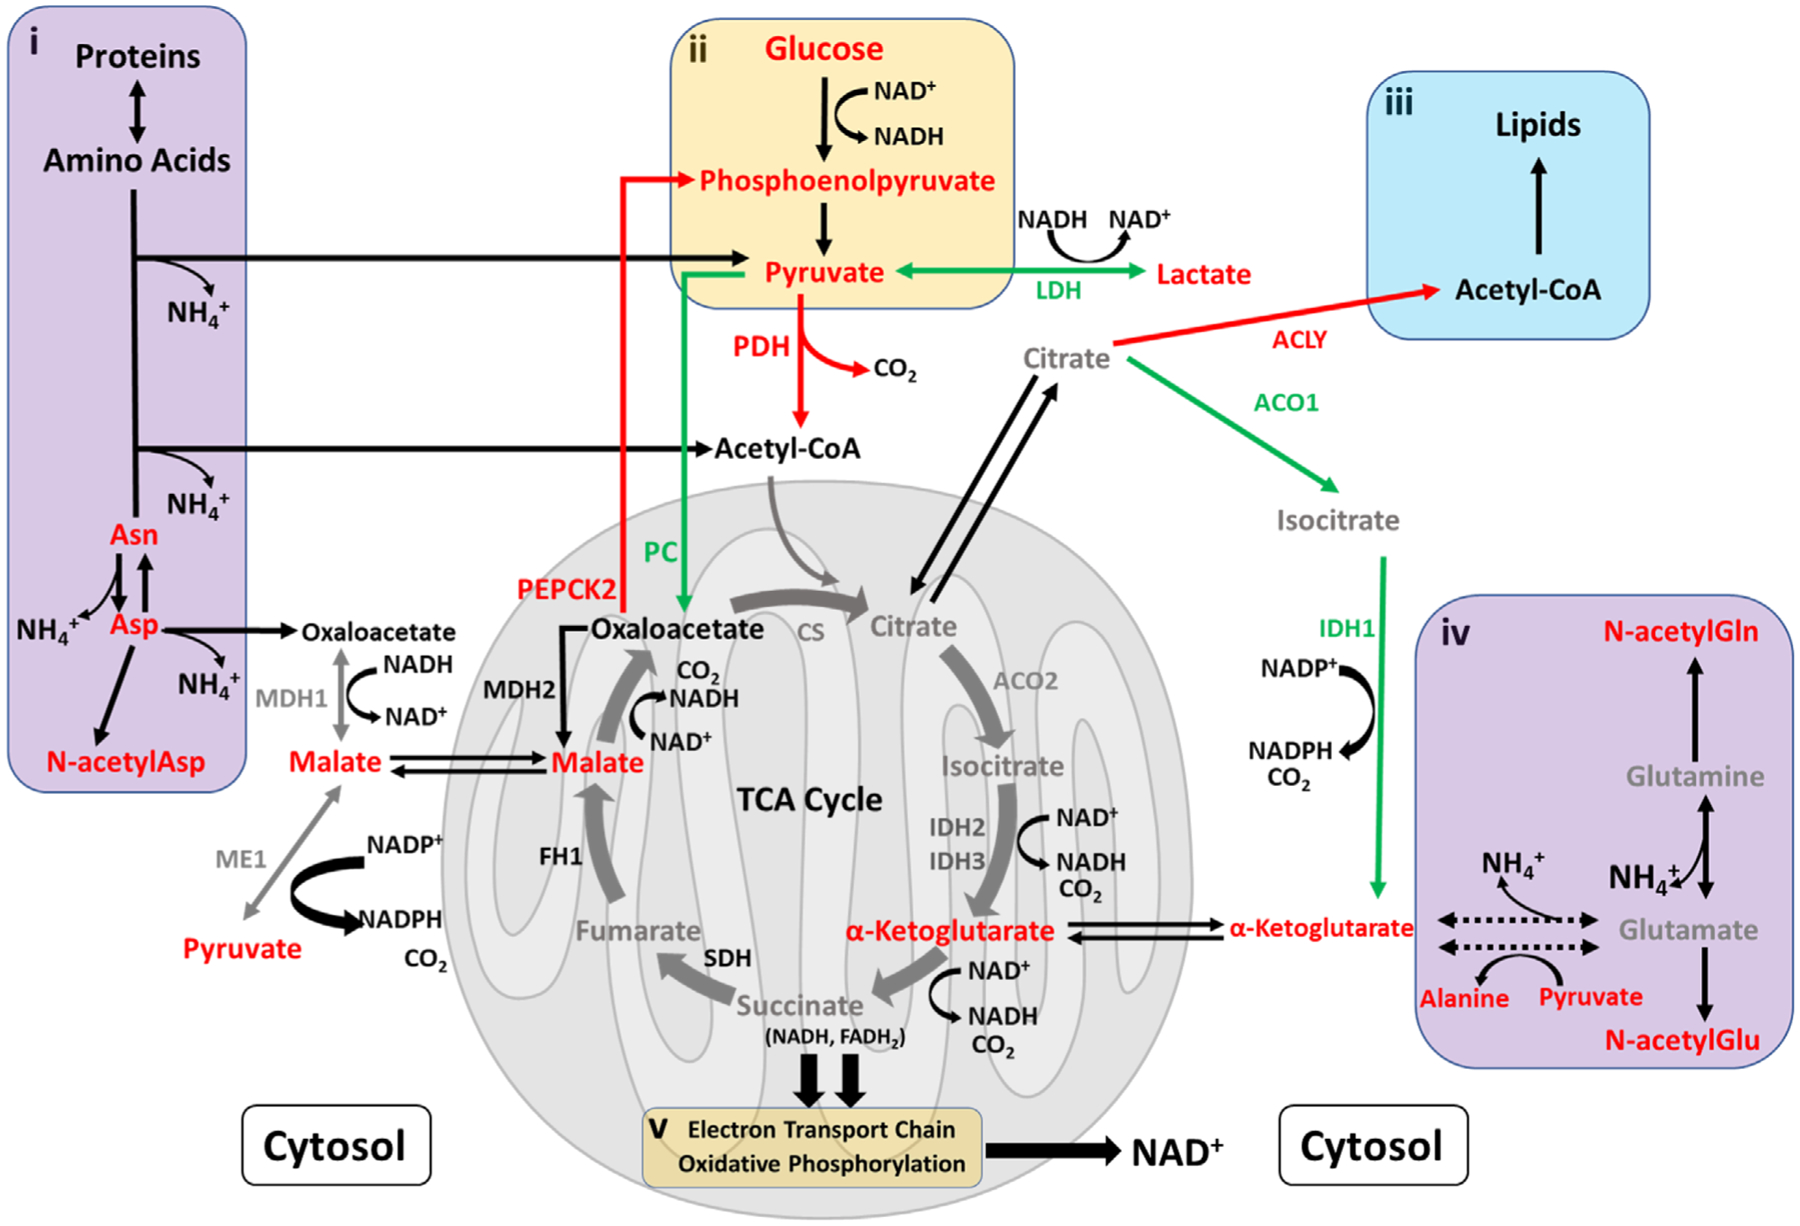
Schematic overview of pathways related to energy metabolism. Red represents an increase (>1.2-fold) in the ratio of the low to control Cys feed condition on day 14, while green indicates a decrease (<0.8-fold). Gray represents no change while black indicates data were not available. In the figure, metabolic enzymes (abbreviated names) are included. Separate insets illustrate: i) breakdown of amino acids and proteins to replenish TCA cycle intermediates, with the release of ammonia as a by-product; ii) abbreviated overview of glycolysis; iii) interconnectivity between lipid metabolism and the TCA cycle; and iv) the well-known glutaminolysis process to support the TCA cycle, with release of ammonia.