Figure 4.

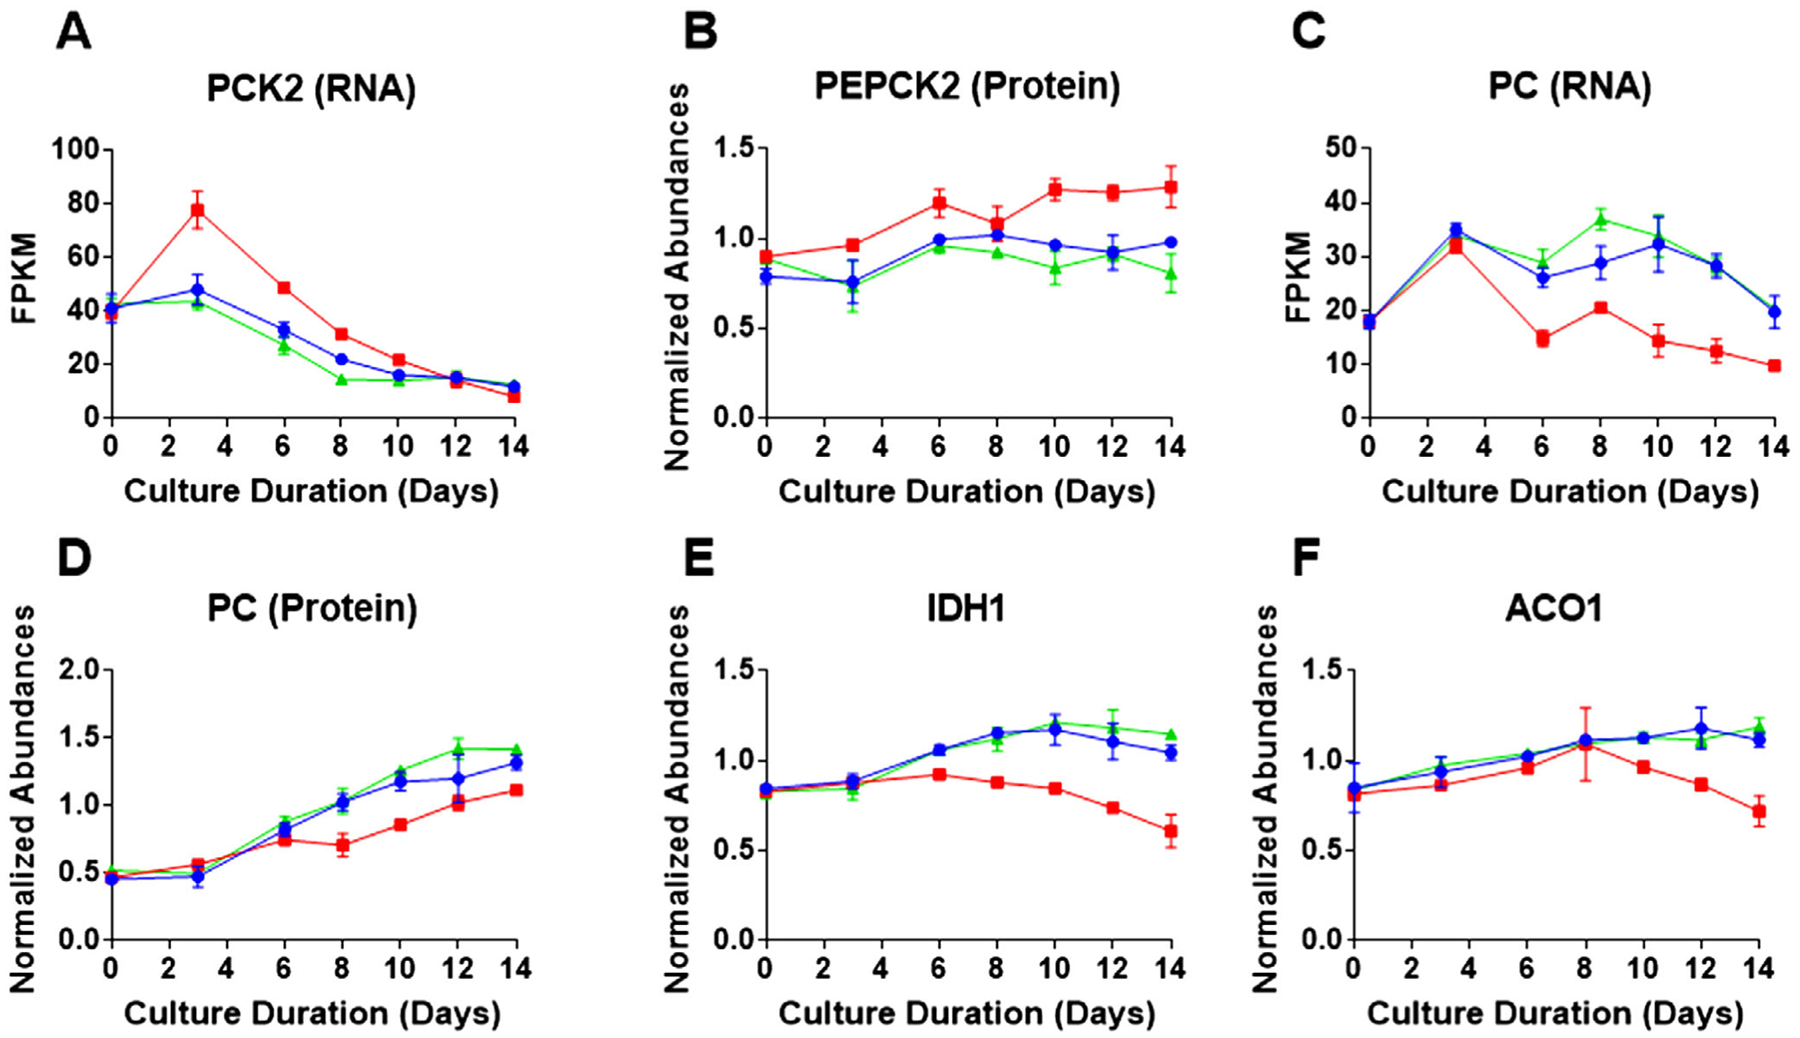
Intracellular time course profiles for proteins and metabolites related to the TCA cycle and energy metabolism. Red, blue, and green represent the three Cys feed concentrations low, control, and high Cys, respectively. Data shown represents the average protein or metabolite abundance for three bioprocess runs with the error bars indicating standard deviation for each of the Cys feed conditions as a function of culture duration for A) PCK2 RNA transcript level; B) PEPCK2 relative protein abundance profile; C) pyruvate carboxylase (PC) RNA level; D) PC relative protein abundance; E) NADPH-dependent isocitrate dehydrogenase (IDH1) protein abundance; and F) NADPH-dependent aconitase (ACO1) protein abundance.
