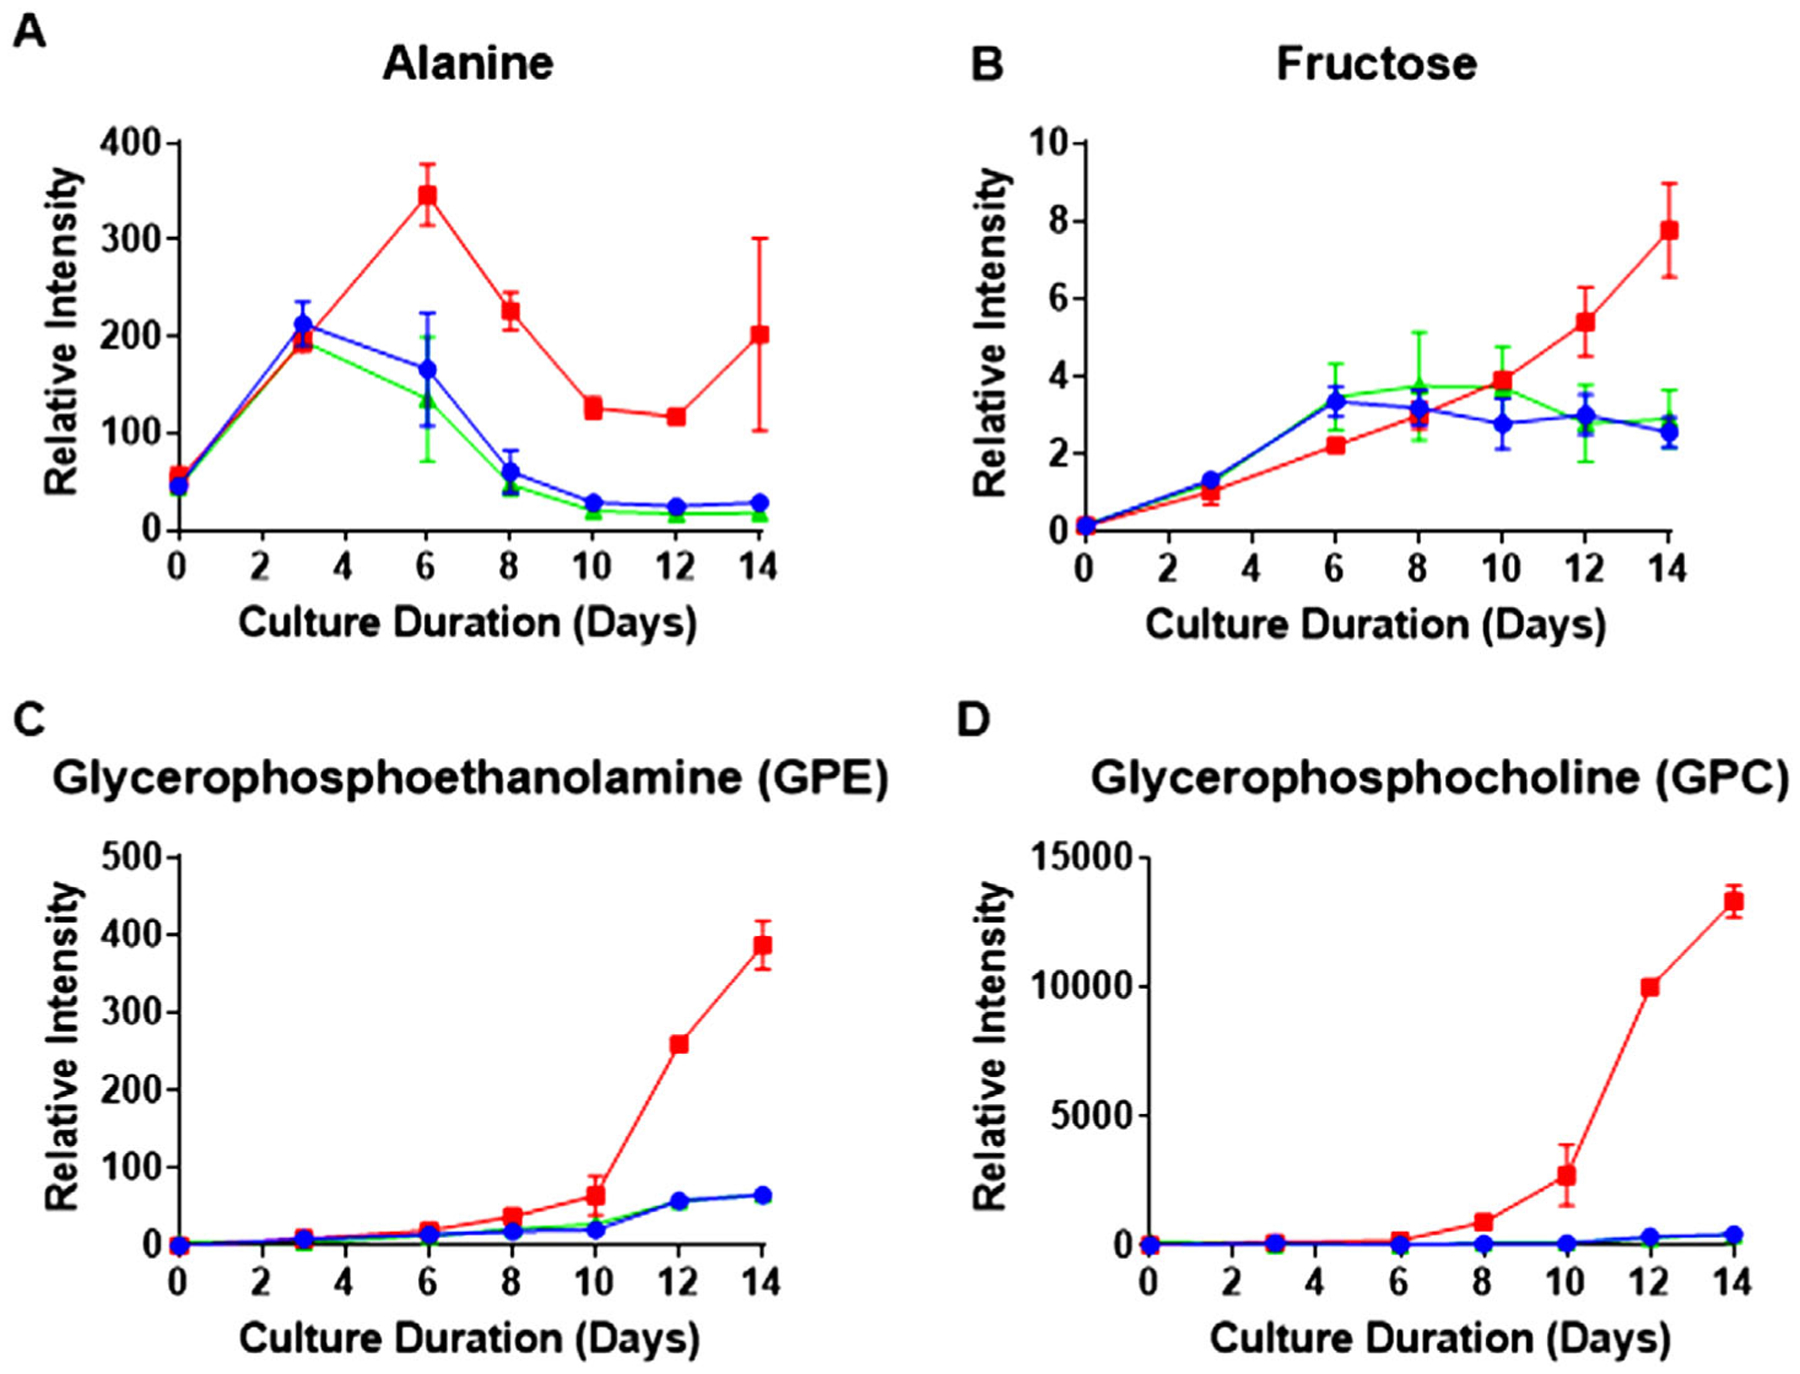
Figure 7.

Extracellular metabolite time course profiles as a function of culture duration. Red, blue, and green represent the three Cys feed concentrations low, control, and high Cys, respectively. A,B) show the average time course of extracellular metabolites measured by GC-MS with error bars indicating standard deviation of relative intensity (n = 2). Both alanine and fructose are among the metabolites observed to increase in the supernatant. C,D) show the increase in lipid degradation products measured in the supernatant by LC-MS with error bars also indicating standard deviation of relative intensity (n = 2).
