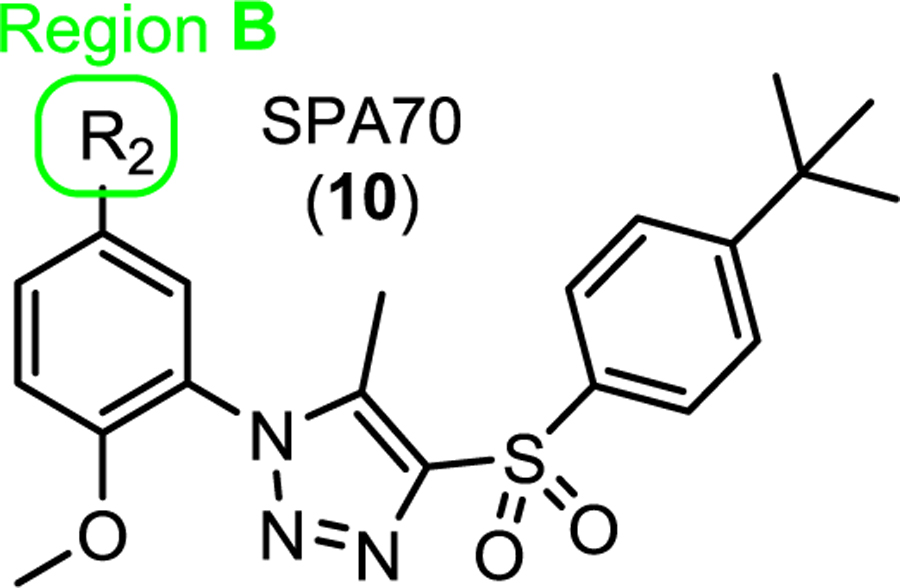
Table 2.
Structures and hPXR activities of SPA70 analogs with modifications at region B in SPA70
 | |||||
|---|---|---|---|---|---|
| Compound | Region B (R2) |
Bindinga (IC50/μM) (%inhibition at 10 μM) | Agonistb (EC50/μM) (%activation at 10 μM) | Inverse agonistc (IC50/μM) (%inhibition at 10 μM) | Antagonistd (IC50/μM) (%inhibition at 10 μM) |
| T0901317 (4) | 0.036 ± 0.006 (100 ± 1)% |
NTe | NT | NT | |
| Rifampicin (1) | NT | 1.4 ± 0.3 (100 ± 4)% |
NA | NT | |
| SPA70 (10) | MeO | 0.19 ± 0.03 (95 ± 2)% |
NAf | 0.024 ± 0.007 (100 ± 3)% |
0.25 ± 0.09 (100 ± 1)% |
| 41 | H | 0.53 ± 0.09 (103 ± 2)% |
0.8 ± 0.3 (56 ± 8)% |
NA | 1.0 ± 0.2 (53 ± 4%)% |
| 42 | F | 0.4 ± 0.1 (80 ± 6)% |
0.24 ± 0.09 (37 ± 7)% |
NA | 0.7 ± 0.1 (70 ± 3)% |
| 43 | Cl | 0.25 ± 0.05 (94 ± 2)% |
NA | 0.27 ± 0.03 (62 ± 2)% |
0.31 ± 0.09 (96 ± 5)% |
| 44 | Br | 0.40 ± 0.03 (96 ± 3)% |
NA | 0.05 ± 0.03 (33 ± 4)% |
0.24 ± 0.03 (99 ± 2)% |
| 45 | Me | 0.8 ± 0.2 (98 ± 1)% |
NA | NA | 2 ± 2 (85 ± 12)% |
| 46 | CF3 | 0.41 ± 0.04 (90 ± 6)% |
NA | NA | 1.01 ± 0.06 (82 ± 4)% |
| 47 | CMe3 | 0.3 ± 0.2 (87 ± 1)% |
0.38 ± 0.06 (113 ± 8)% |
NA | NA |
| 48 | CN | 0.4 ± 0.1 (98 ± 4)% |
NA | 0.05 ± 0.04 (34 ± 3)% |
0.45 ± 0.07 (96 ± 1)% |
| 50 | CH2OH | 1.4 ± 0.7 (95 ± 2)% |
0.81 ± 0.02 (82 ± 5)% |
NA | 2.0 ± 0.3 (64 ± 7)% |
| 51 | CONH2 | 1.1 ± 0.1 (95 ± 1)% |
2.44 ± 0.02 (182 ± 16)% |
NA | NA |
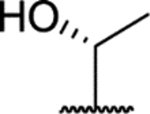
| 54 (R) |  |
1.1 ± 0.1 (94 ± 2)% |
0.44 ± 0.04 (123 ± 22)% |
NA | NA |
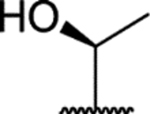
| 55 (S) |  |
1.3 ± 0.4 (95 ± 1)% |
0.64 ± 0.01 (112 ± 11)% |
NA | NA |
T0901317 (4) at 10 μM as 100% inhibition and DMSO (0.3%) as 0% inhibition for the hPXR binding assay;
Rifampicin (1) at 10 μM as 100% activation and DMSO (0.3%) as 0% activation for the cell-based hPXR agonistic assay;
SPA70 (10) at 10 μM as 100% inhibition and DMSO (0.3%) as 0% inhibition for the cell-based hPXR inverse agonistic assay;
SPA70 (10) at 10 μM with rifampicin (1, 5 μM) as 100% inhibition and rifampicin alone (1, 5 μM) as 0% inhibition for the cell-based hPXR antagonistic assay;
NT: not tested;
NA: no IC50 value could be experimentally determined within the concentration range tested (highest concentration tested at 30 μM).
