Table 4.
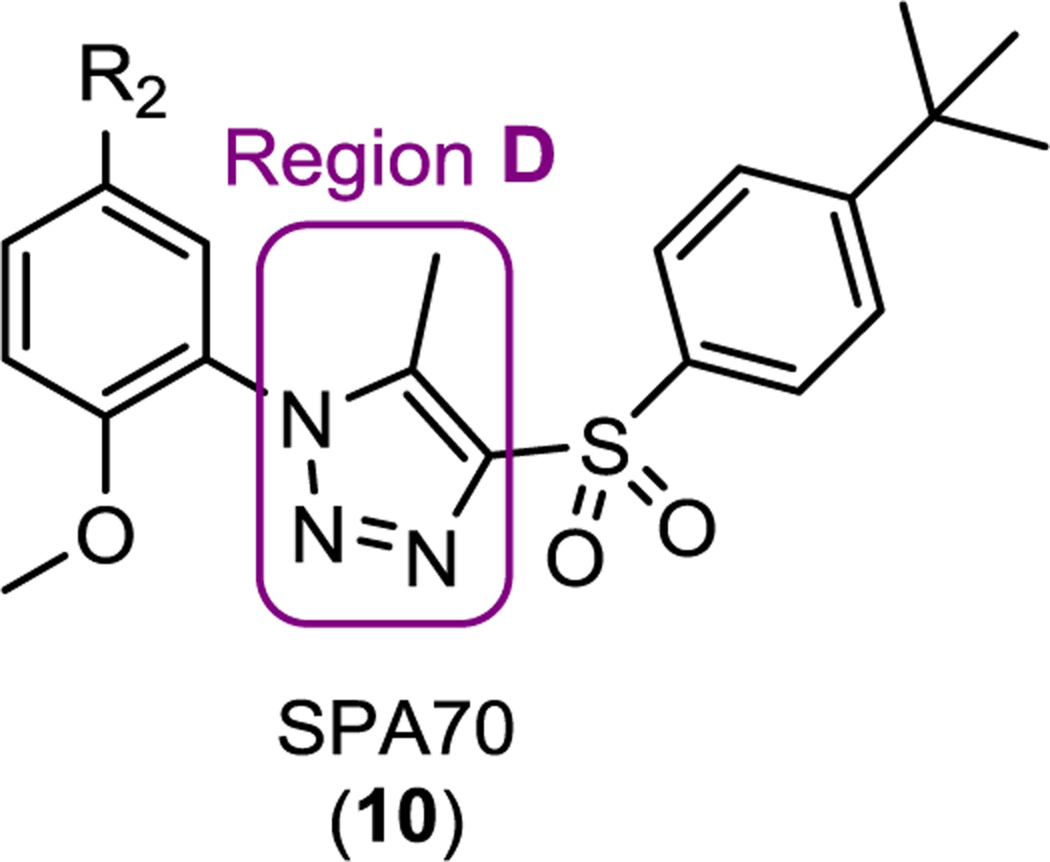
Structures and hPXR activities of SPA70 analogs with modifications at region D (the 1H-1,2,3-triazole component in SPA70)
 | ||||||
|---|---|---|---|---|---|---|
| Compound | R2 | Region D | Bindinga (IC50/μM) (%inhibition at 10 μM) | Agonistb (EC50/μM) (%activation at 10 μM) | Inverse agonistc (IC50/μM) (%inhibition at 10 μM) |
Antagonistd (IC50/μM) (%inhibition at 10 μM) |
| T0901317 (4) | 0.036 ± 0.006 (100 ± 1) % |
NTe | NT | NT | ||
| Rifampicin (1) | NT | 1.4 ± 0.3 (100 ± 4)% |
NA | NT | ||
| SPA70 (10) |
MeO | 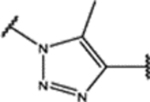 |
0.19 ± 0.03 (95 ± 2)% |
NAf | 0.024 ± 0.007 (100 ± 3)% |
0.25 ± 0.09 (100 ± 1)% |
| 97 | MeO | 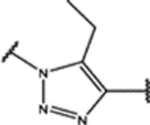 |
0.8 ± 0.2 (94 ± 1)% |
NA | NA | 0.500 ± 0.007 (82 ± 5)% |
| 98 | Me | 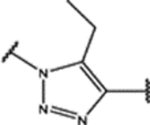 |
1.0 ± 0.3 (90 ± 10)% |
NA | NA | 0.8 ± 0.1 (81 ± 5)% |
| 99 | Cl | 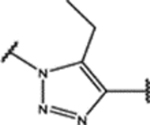 |
0.7 ± 0.1 (93 ± 3)% |
NA | NA | 0.96 ± 0.07 (81 ± 4)% |
| 100 | MeO | 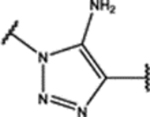 |
0.18 ± 0.05 (85 ± 2)% |
0.43 ± 0.05 (53 ± 6)% |
NA | 1.7 ± 0.1 (52 ± 4)% |
| 101 | Me | 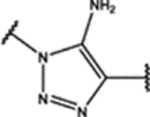 |
0.28 ± 0.05 (88 ± 6)% |
0.16 ± 0.07 (73 ± 10)% |
NA | 3.3 ± 0.4 (46 ± 5)% |
| 102 | Cl | 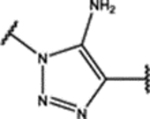 |
0.5 ± 0.1 (93 ± 1)% |
0.110 ± 0.008 (42 ± 13)% |
NA | 4.4 ± 0.5 (78 ± 1)% |
| 103 | MeO | 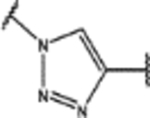 |
1.4 ± 0.3 (98 ± 1)% |
1.4 ± 0.2 (35 ± 13)% |
NA | 3.4 ± 0.3 (71 ± 3)% |
| 104 | Me | 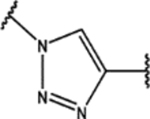 |
0.5 ± 0.2 (98 ± 5)% |
0.6 ± 0.2 (69 ± 9)% |
NA | 5 ± 1 (44 ± 9)% |
| 105 | Cl | 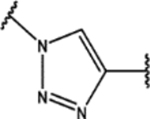 |
0.48 ± 0.05 (91 ± 1)% |
0.77 ± 0.09 (65 ± 11)% |
NA | 10.5 ± 0.1 (57 ± 11)% |
| 109 | MeO | 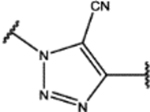 |
0.3 ± 0.1 (97 ± 1)% |
0.26 ± 0.06 (88 ± 7)% |
NA | 2.4 ± 0.2 (38 ± 2)% |
| 110 | Me | 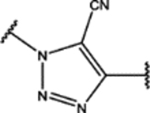 |
0.21 ± 0.06 (97 ± 1)% |
0.16 ± 0.03 (131 ± 23)% |
NA | NA |
| 111 | Cl | 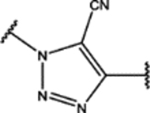 |
0.061 ± 0.008 (90 ± 2)% |
0.08 ± 0.04 (105 ± 18)% |
NA | NA |
| 112 | MeO | 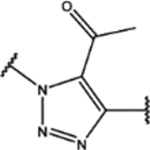 |
0.7 ± 0.3 (91 ± 2)% |
1.9 ± 0.7 (135 ± 18)% |
NA | NA |
| 113 | Me | 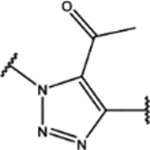 |
0.26 ± 0.09 (94 ± 3)% |
0.5 ± 0.2 (125 ± 24)% |
NA | NA |
| 114 | Cl | 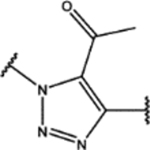 |
0.4 ± 0.3 (96 ± 4)% |
0.20 ± 0.06 (104 ± 11)% |
NA | NA |
| 122 | MeO | 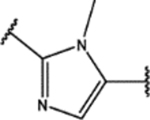 |
2.5 ± 0.8 (87 ± 13)% |
4 ± 2 (67 ± 3)% |
NA | NA |
| 123 | Me | 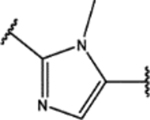 |
1.6 ± 0.6 (92 ± 3)% |
0.99 ± 0.05 (74 ± 7)% |
NA | NA |
| 124 | Cl | 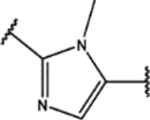 |
0.55 ± 0.02 (60 ± 1)% |
1.21 ± 0.05 (81 ± 9)% |
NA | NA |
| 128 | MeO | 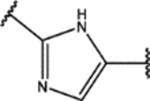 |
3.08 ± 0.02 (68 ± 16)% |
0.7 ± 0.3 (86 ± 4)% |
NA | NA |
| 129 | Me | 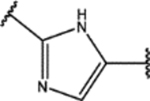 |
1.4 ± 0.6 (77 ± 13)% |
0.7 ± 0.2 (102 ± 12)% |
NA | NA |
| 130 | Cl |  |
1.3 ± 0.5 (81 ± 16)% |
0.36 ± 0.07 (71 ± 10)% |
NA | NA |
| 140 | MeO | 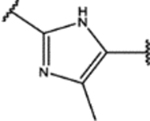 |
2.0 ± 0.4 (84 ± 17)% |
6 ± 2 (86 ± 9)% |
NA | NA |
| 145 | Cl | 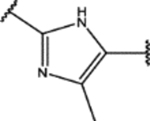 |
0.9 ± 0.4 (81 ± 16)% |
0.5 ± 0.3 (100 ± 10)% |
NA | NA |
| 150 | Me | 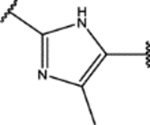 |
0.8 ± 0.3 (82 ± 13)% |
1.8 ± 0.4 (106 ± 17)% |
NA | NA |
| 155 | MeO | 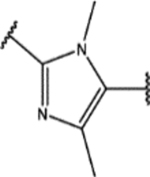 |
2.1 ± 0.4 (80 ± 13)% |
1.2 ± 0.3 (97 ± 10)% |
NA | NA |
| 156 | Me | 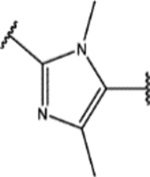 |
0.4 ± 0.1 (73 ± 2)% |
1.0 ± 0.3 (89 ± 9)% |
NA | NA |
| 157 | Cl | 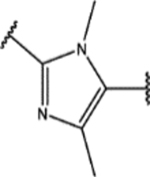 |
0.35 ± 0.03 (77 ± 4)% |
1.2 ± 0.5 (84 ± 9)% |
NA | NA |
T0901317 (4) at 10 μM as 100% inhibition and DMSO (0.3%) as 0% inhibition for the hPXR binding assay;
Rifampicin (1) at 10 μM as 100% activation and DMSO (0.3%) as 0% activation for the cell-based hPXR agonistic assay;
SPA70 (10) at 10 μM as 100% inhibition and DMSO (0.3%) as 0% inhibition for the cell-based hPXR inverse agonistic assay;
SPA70 (10) at 10 μM with rifampicin (1, 5 μM) as 100% inhibition and rifampicin alone (1, 5 μM) as 0% inhibition for the cell-based hPXR antagonistic assay;
NT: not tested;
NA: no IC50 value could be experimentally determined within the concentration range tested (highest concentration tested at 30 μM).
