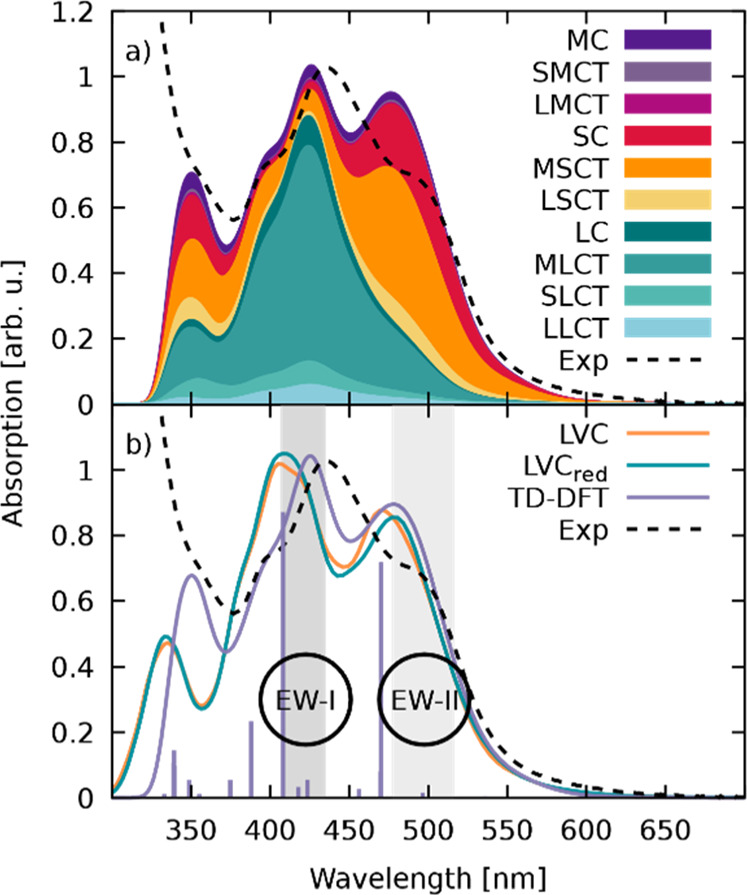
Figure 4.

(a) Experimental21 (dashed, black) and TD-DFT calculated (solid, black) absorption spectra of [Ru(S–Sbpy)(bpy)2]2+ in acetonitrile decomposed into different types of excitations. The scheme for labeling the types of excitation denotes the ruthenium atom as M, the S–Sbpy ligand as S, and each bpy ligand as L. From this, excitations within each fragment are written as MC, SC, and LC, while the electron transfer between fragments is denoted XYCT, where X represents the fragment from which the electron is excited and Y the fragment to which it is excited. (b) Absorption spectra calculated with the full-parametrized LVC template (LVC), the reduced LVC template (LVCred), the ab initio TD-DFT absorption spectrum (TD-DFT), and the experimental one (exp). The electronically excited states at the optimized equilibrium geometry are indicated by bars at the corresponding energy with the relative height given by a normalized oscillator strength. EWs I and II used in the dynamics simulations are highlighted in gray.
