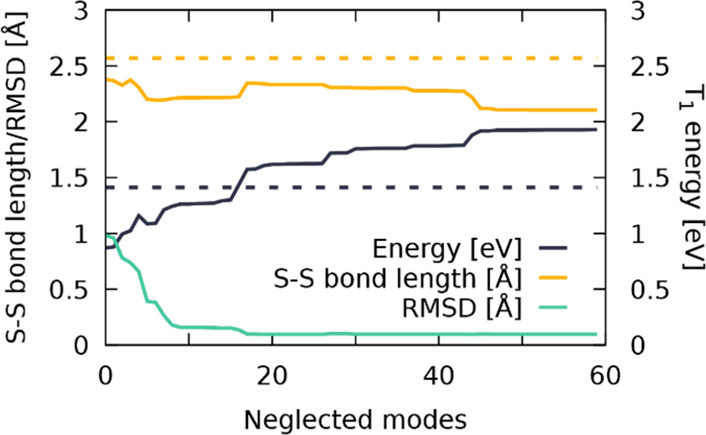
Figure 5.

S–S bond length (Å, yellow), T1 energy (eV, dark blue), and the RMSD (Å, teal) of the LVC-optimized T1 geometry as a function of the number of neglected normal modes. Values for the full-dimensional geometry optimization at the B3LYP/6-311G(d)-LANL2DZ level of theory are shown in dashed lines.
