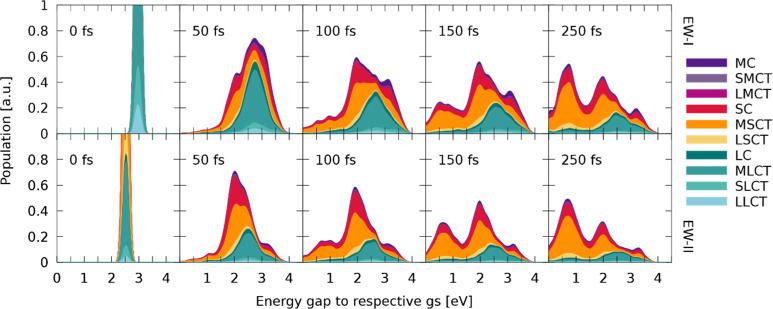
Figure 7.
Evolution of the excited-state wavepacket for different time-steps throughout the dynamics starting from EWs I (top) and II (bottom). Each panel contains information about the active state at the given time-step for each trajectory to provide an overview of the distribution of energy gaps for each time frame. The CT character of every trajectory is plotted against the energy gap to the S0 state at the corresponding geometry. For this, the character of the diabatic quantum population of a trajectory is transformed into the corresponding CT characters and then depicted at the energy gap of the currently active state to the S0 energy of this trajectory at this state. All these values are then convoluted to yield the shown wavepackets.

