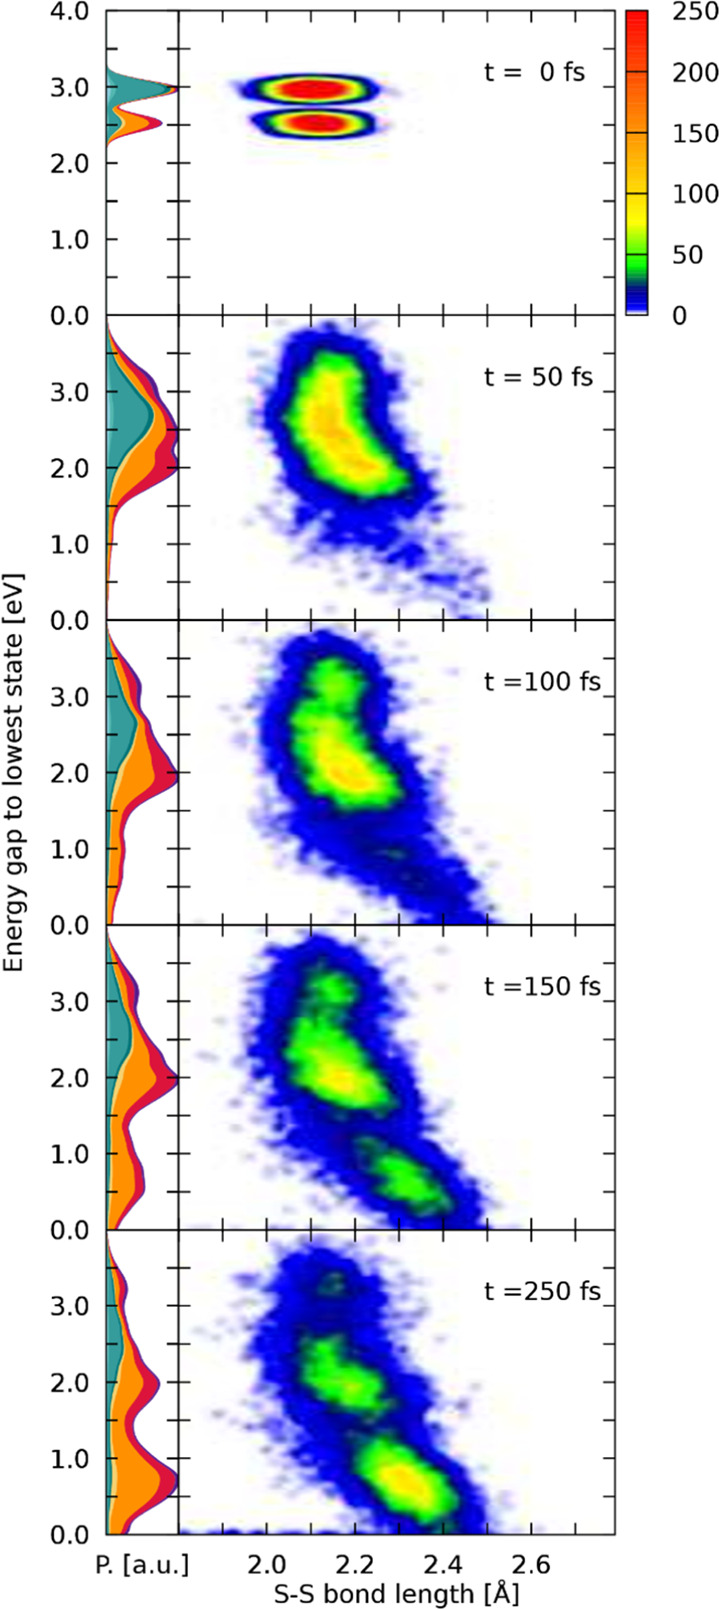
Figure 8.

Left-hand side panels show the distribution of the wave function character against the energy gap between the classical active state and the lowest singlet state, similar to Figure 7, with the difference being that trajectories from both EWs are combined. The nuclear density is normalized in every time-step. On the right-hand side, a convoluted scatter plot of the S–S bond length with the corresponding energy gaps to the lowest state is given.
