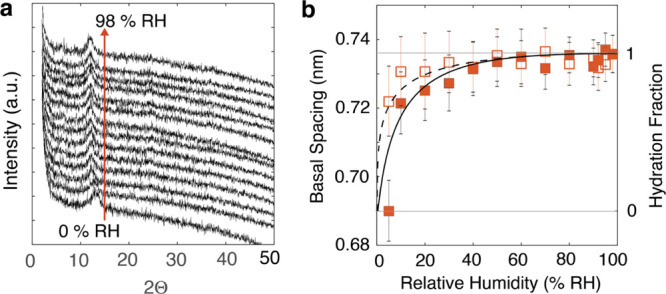
Figure 3.

(a) Transmission-mode XRD diffractograms of AcidBir exposed to 0–98% RH and (b) result of d001 basal spacing (left ordinate axis) analyses from these data (filled square = adsorption; open square = desorption), also showing uncertainties. The model predictions of d001 in (b) (full line for adsorption; dashed for desorption) were taken from the Dubinin–Asthakhov theory46 term derived from the microgravimetric water binding data (Figure 2a). This model prediction of the hydration fraction (right ordinate axis) was scaled such that d001 = 0.690 nm at 0 W (0 H2O/UC) and d001 = 0.735 nm at 1 W (1.33 H2O/UC). Diffractograms for δ-MnO2 were of insufficient quality to be shown here, due to the small particle size.
