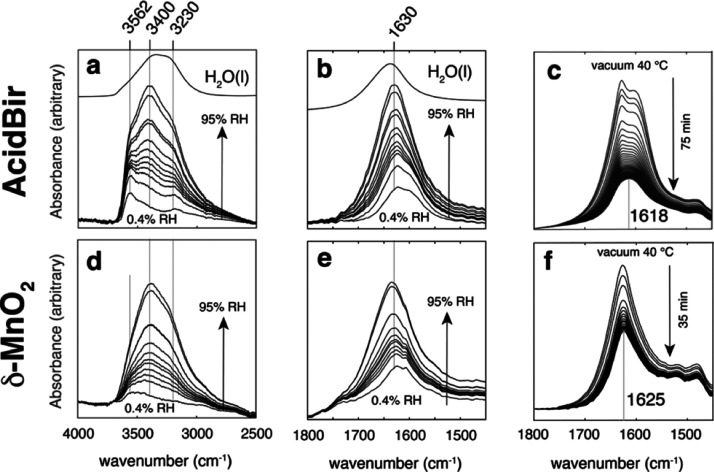
Figure 4.
FTIR spectra of (a–c) AcidBir and (d–f) δ-MnO2. Samples were collected in ATR mode for experiments in the 0.4–95% RH range (adsorption leg) at 25 °C (a,b,d,e) and in transmission mode for samples exposed to vacuum at 40 °C (c,f). Note that the intensities in c and f are lower than those at 0.4% RH, and represent very low hydration states.

