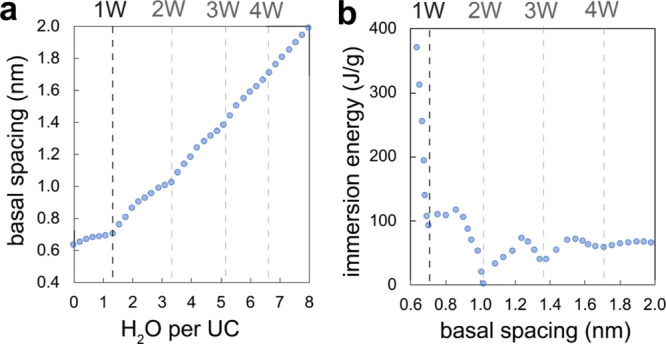
Figure 6.

(a) Predicted d001 (along the UC c axis) as a function of water loading, here expressed as the water molecule per UC of K+-birnessite. (b) Corresponding immersion energy profiles vs d001. Here, 0.705 nm = 1 W and 1.02 nm = 2 W. Note that the immersion energy curve indicates possible higher and quasi-stable hydration states at 1.36 (3 W) and 1.68 (4 W) nm. See Figure S8 for comparison with Na-birnessite, which was also reported in the literature.30 Dashed vertical lines indicate the loci of hydration states.
