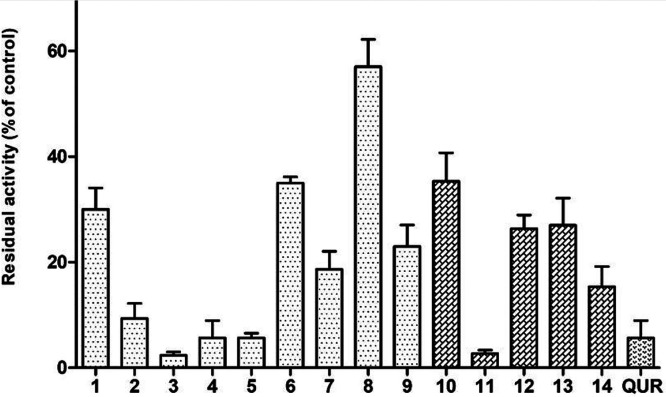
Figure 6.
Inhibition of aggregation of PHF6 tau sequence (50 μM) by 10 μM test molecules. Quercetin (QUR) was used as reference compound. Bars represent the mean ± SD of residual aggregation compared with control (CTR). Clear and dark filling patterns are for naphthoquinones and anthraquinones, respectively.

