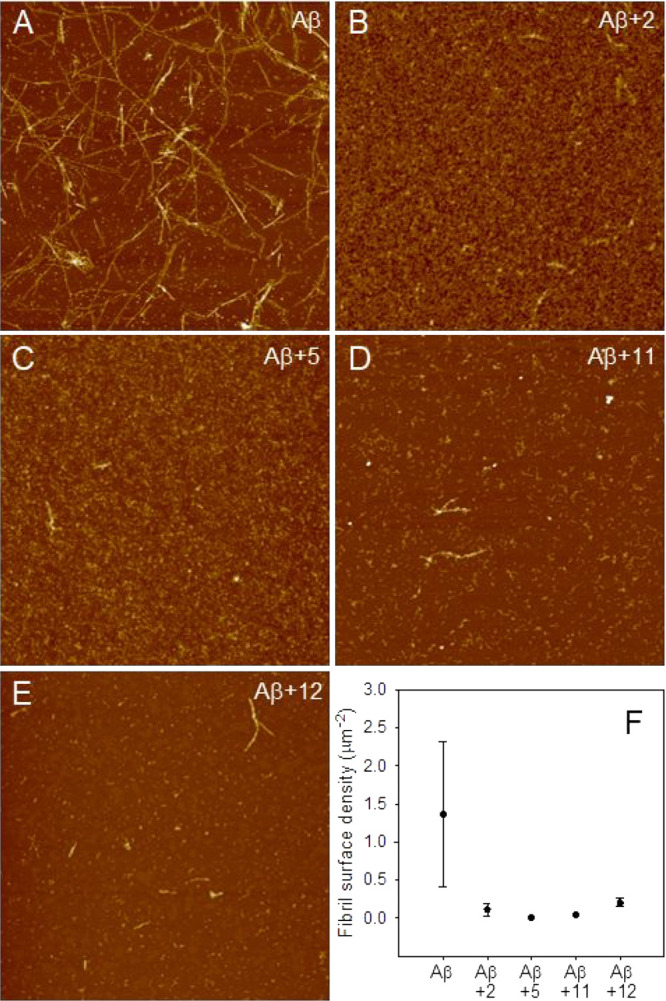
Figure 9.

Inhibition of Aβ42 fibrillation tested by AFM. Tapping mode AFM images of Aβ42 after 72 h of aggregation at room temperature in the absence (A) and in the presence of compounds 2 (B), 5 (C), 11 (D), and 12 (E). Scan size was 5.0 μM. Z range was 25 nm. (F) Quantitative evaluation of the fibril surface density (number of fibrils per unit area) in the absence and in the presence of the compounds. Mean values obtained on at least six different areas of 100 μm2 are reported. Errors were calculated using Student’s statistics, assuming a confidence level of 95%.
