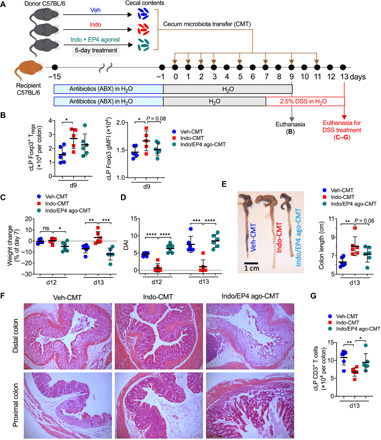
Fig. 5. Altered gut microbiota by PGE2-EP4 signaling suppresses intestinal Treg responses and promotes intestinal inflammation.

(A) Experimental schematic diagram of cecal microbiota transplantation (CMT). Recipient C57BL/6 mice were pretreated with antibiotics for 2 weeks and rest for 1 day before receiving fresh cecal microbiota collected from C57BL/6 mice that had been treated with vehicle (Veh-CMT), indomethacin (Indo-CMT), or indomethacin plus EP4 agonist, L-902,688 (Indo/EP4 ago-CMT) for 5 days. After antibiotics treatment, some recipient mice were given back normal drinking water for 9 days before euthanized for analysis of colon immune cells [for (B)], while some other recipient mice were given back normal drinking water for 7 days, followed by administration with DSS in drinking water to induce colonic inflammation [for (C) to (G)]. (B) Numbers of colon LP Foxp3+ Tregs (left) and Foxp3 gMFI (right) in the recipient mice on day 9 after CMT (n = 5 to 6 each group). (C) Changes in body weight of recipient mice showing percentages of that at the beginning of DSS treatment (i.e., day 7). (D) DAI of the recipient mice (right) (n = 6 each group). (E) Representative images of the cecum and colon tissues (left) and colon lengths (right) of the recipient mice on day 13. Photo credit: Marie Goepp, University of Edinburgh. (F) Representative histological (hematoxylin and eosin–stained) images of distal (top row) and proximal (bottom row) colons of the recipient mice (all at same magnification, 100×). Scale bar, 200 μm. (G) Numbers of infiltrated CD3+ T cells in colon LP of the recipient mice. Each scatter dot plot in bar graphs represents data from one mouse. Data shown as means ± SD are analyzed by ANOVA with post hoc Holm-Sidak’s multiple comparisons test (B to E and G). *P < 0.05, **P < 0.01, ***P < 0.001, and ****P < 0.0001.
