
Fig. 7. Type I IFNs produced by MNPs mediate PGE2 suppression of intestinal Tregs.
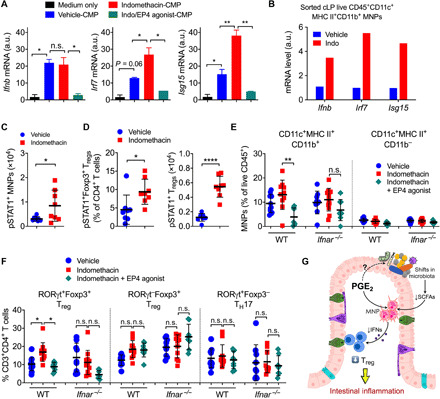
(A) Gene expression of Ifnb, Irf7, and Isg15 in BMDCs cultured with CMPs that were isolated from mice treated with vehicle, indomethacin, or indomethacin plus EP4 agonist. Data shown as means ± SEM of duplicates are representative of two independent experiments. a.u., arbitrary units. (B) Gene expression of Ifnb, Irf7, and Isg15 in sorted colonic MNPs from vehicle- or indomethacin-treated mice. Each sample was pooled from three to four mice. Data shown as mean gene expression of technical duplicates or triplicates are representative of two independent experiments. (C) Numbers of colonic phosphorylated STAT1–positive (pSTAT1+) MNPs and Tregs in mice treated with vehicle or indomethacin (n = 8 each). (D) Percentages and numbers of colon LP pSTAT1+Foxp3+ Tregs. (E) Percentages of colon LP CD11c+MHC II+CD11b+ and CD11c+MHC II+CD11b− MNPs in WT and Ifnar−/− mice treated with vehicle, indomethacin, or indomethacin plus EP4 agonist (n = 7 to 12). (F) Percentages of colon LP RORγt+Foxp3+ Tregs, RORγt−Foxp3+ Tregs, and RORγt+Foxp3− TH17 cells. Each scatter dot plot represents data from one mouse. Data shown as means ± SD are pooled from two (C and D) or four (E and F) independent experiments. Two-tailed unpaired Student’s t test (C and D) or ANOVA with Holm-Sidak’s multiple comparisons test (A, E, and F). *P < 0.05, **P < 0.01, and ****P < 0.0001. n.s., not significant. (G) Diagram illustrating how PGE2 suppresses intestinal Treg responses through shaping the gut microbiota composition and modulation of MNP functions.