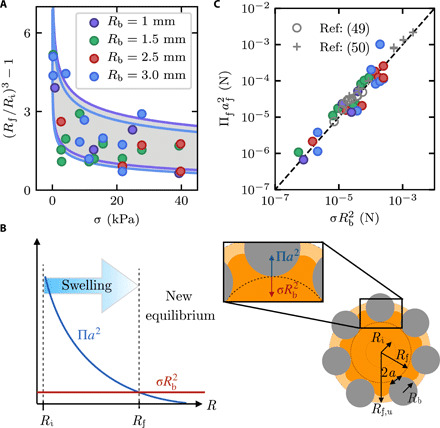
Fig. 3. Hydrogel swelling is determined by the competition between osmotic swelling and local confinement.

(A) Fractional change in hydrogel volume ~ R3 decreases with increasing stress σ, in media with different mean bead radii Rb. Curves show the prediction of Eq. 4; colors show Rb, and different sets of curves show ±1 SD in Ri from the measured mean. (B) Net osmotic swelling force (blue curve) decreases as the hydrogel swells and is eventually balanced by the confining force transmitted by beads (red curve). Right schematic shows a hydrogel of initial radius Ri (inner circle), hindered swollen radius Rf (dark orange with dashed circle), and equilibrium unconfined swollen radius Rf,u (light orange) surrounded by beads (gray). Inset illustrates the force exerted by beads (red) and the force exerted by the swelling hydrogel at the contact (blue). (C) Hydrogel swelling in confinement is described by the balance between the net osmotic swelling force and the confining force transmitted by the medium , each computed from independent measurements, as shown by the dashed line. Gray points show the results of our calculation based on measurements of water absorption by hydrogels in soil from (49, 50).
