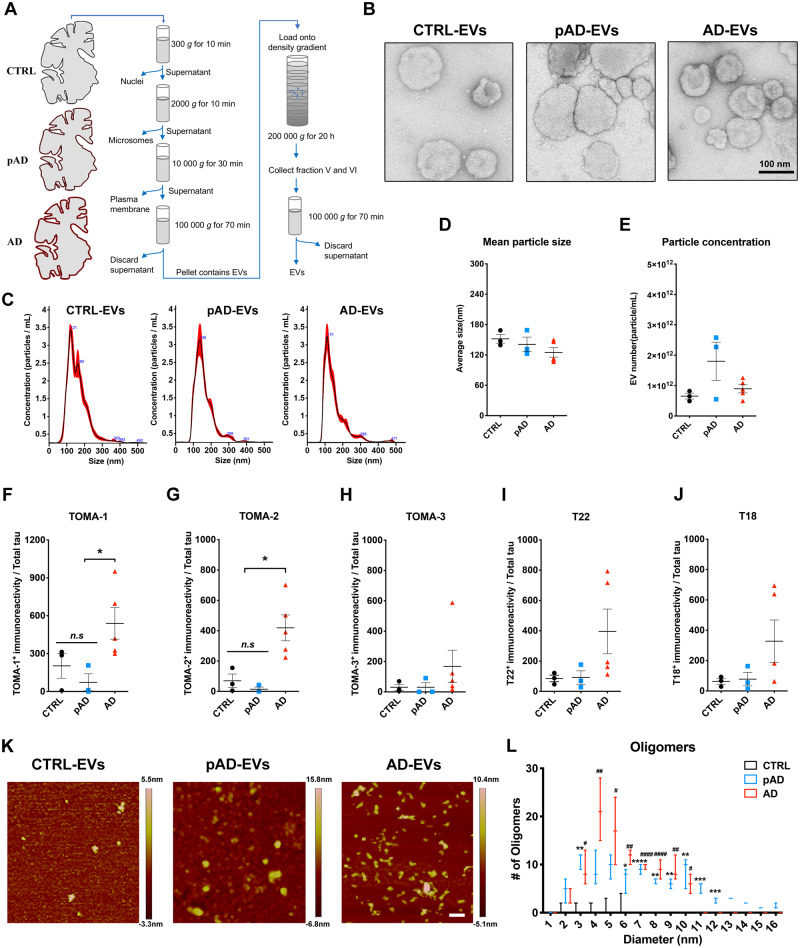
Figure 1.
Characterization of EVs by TEM, nanoparticle tracking analysis, tau oligomer dot-blotting and atomic force microscopy. (A) A schema of EV separation from human frozen brain tissue. (B) TEM image of human brain-derived EVs. (C–E) Nanoparticle tracking analysis of isolated EVs (C), quantification of EV size (D) and EV density (E). (F–J) Semi-quantification of tau oligomers in EVs by multiple tau oligomer antibodies. Dot blot images are provided in Supplementary Fig. 1A. *P < 0.05, as determined by one-way ANOVA (alpha = 0.05) and Tukey’s post hoc. Graphs indicate mean ± SEM. Each dot represents an individual donor, three replicates per subject, three donors per group for control (CTRL) and pAD, five donors for the Alzheimer’s disease (AD) group (Supplementary Table 2). (K and L) Atomic force microscopy images showing brain-derived EV-tau oligomers isolated from CTRL, pAD, and Alzheimer’s disease brains (K). Scale bars = 200 nm. Size distribution histogram of EV-tau oligomers (L). *P < 0.05, **P < 0.01, ***P < 0.005 and ****P < 0.0001 for pAD EVs versus CTRL EVs; #P < 0.05, ##P < 0.01, and ####P < 0.0001 for Alzheimer’s disease EVs versus CTRL EVs as determined by one-way ANOVA (alpha = 0.05) and Tukey’s post hoc. Graphs indicate mean ± SEM. n = 3 images per sample. AD = Alzheimer’s disease; CTRL = control.

