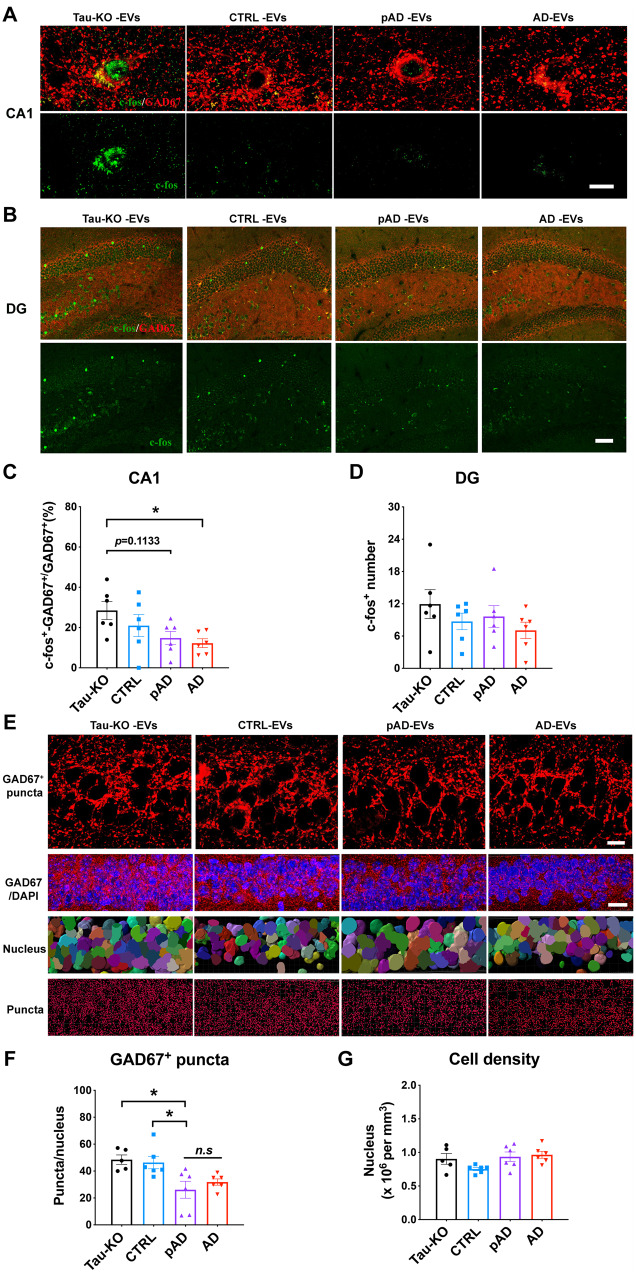
Figure 7.
Reduction in c-fos expression in GAD67+ GABAergic interneurons and GAD67+ puncta around CA1 pyramidal cells in Alzheimer’s disease EV and pAD EV injected aged B6 mice. (A–D) GAD67 (red) and c-fos (green) co-staining images and quantification of the percentage of c-fos+ GAD67+ cells in all GAD67+ cells in CA1 region (A and C) and total c-fos+ positive cells in the dentate gyrus (DG) region (B and D). Scale bar = 10 μm (A), 50 μm (B). *P < 0.05 Alzheimer’s disease EVs compared with the tau-KO EV group, as determined by one-way ANOVA (alpha = 0.05) and Tukey’s post hoc. n = 6 mice per group for quantification. At least two sections were imaged per animal. Each dot represents mean value per animal. Graphs indicate mean ± SEM. (E) High magnification images in top panels compared GAD67 expression (red) in CA1 pyramidal cells of the hippocampus in all four injected tau-KO, control, pAD or Alzheimer’s disease (AD) EV groups. Scale bar = 10 μm. Second panel shows lower magnification images of GAD67 expression and DAPI staining. Scale bar = 20 μm. Third panel shows cells counted by Imaris software based on DAPI staining. Bottom panel shows GAD67+ puncta analysis by Imaris. Scale bar = 10 μm. (F and G) Quantification of GAD67+ puncta (F) and total cell number in CA1 of hippocampus (G). *P < 0.05, pAD EV compared with tau-KO and control EV groups, as determined by one-way ANOVA (alpha = 0.05) and Dunnett’s post hoc. n = 5–6 mice per group for quantification. At least two sections were imaged per animal. Each dot represents mean value per animal. Graphs indicate mean ± SEM. (A–G) Control (Donors 1 and 2), pAD (Donors 4 and 5), and Alzheimer’s disease (Donors 7 and 9) were used (Supplementary Table 2).

