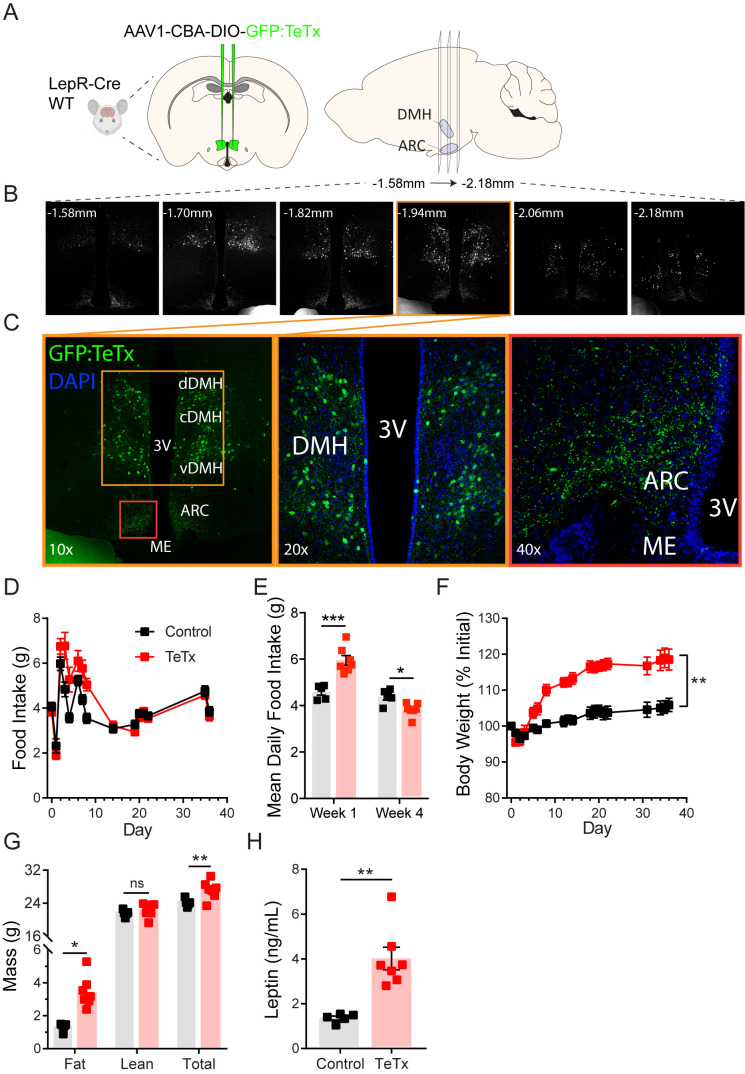
Figure 1. Silencing DMHLepR neurons elicits transient hyperphagia and increased adiposity in adult male mice.
(A) Experimental schematic for chronic inhibition of DMHLepR by microinjection on day 0 of an AAV1 containing a Cre-dependent GFP-fused TeTx delivered bilaterally to the DMH of LepR-Cre+ male mice (TeTx; n=7) and Cre-negative littermate controls (control; n=5). (B) Stereological fluorescent images from a representative animal showing the rostral-caudal extent of GFP:TeTx expression. (C) Left: colorized, higher magnification view of the boxed orange region from (B). Middle: higher magnification view of the boxed orange region showing neuronal cell bodies targeted within the DMH. Right: higher magnification view of the boxed red region showing GFP:TeTx+ terminals of targeted DMHLepR neurons within the arcuate nucleus (ARC). (D) Mean daily food intake following viral microinjection. Two-way ANOVA: F(1,10)=4.658; p=0.0563 (main effect of TeTx); F(14,140)=4.886; p<0.0001 (time x TeTx interaction). (E) Mean daily food intake from week 1 relative to week 4. Two-way ANOVA: F(1,10)=5.575; p=0.0399 (main effect of TeTx); F(1,10)=39; p<0.001 (time x TeTx interaction). (F) Body weight expressed as %day 0 value. Two-way ANOVA: F(1,10)=20.18; p=0.0012 (main effect of TeTx). F(19,190)=14.67; p<0.0001 (time x TeTx interaction). (G) Fat, lean, and total mass 26 days after viral microinjection. Multiple t-tests; tfat=4.847; p=0.0014; ttotal=2.884; p=0.016. (H) Plasma leptin 21 days after viral microinjection. Unpaired t-test, t=5.17, p=0.0017. Data are mean ± SEM. For repeated measures, post hoc Sidak’s test for each time point is indicated on the graph. *p<0.05,**p<0.01, ***p<0.001, ****p<0.0001.


