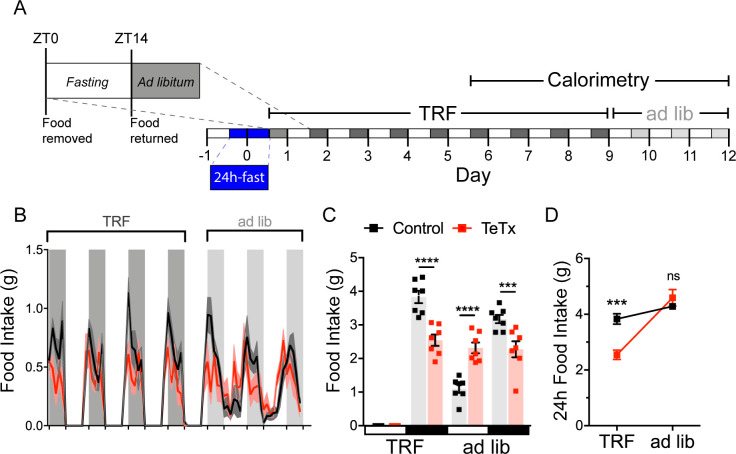
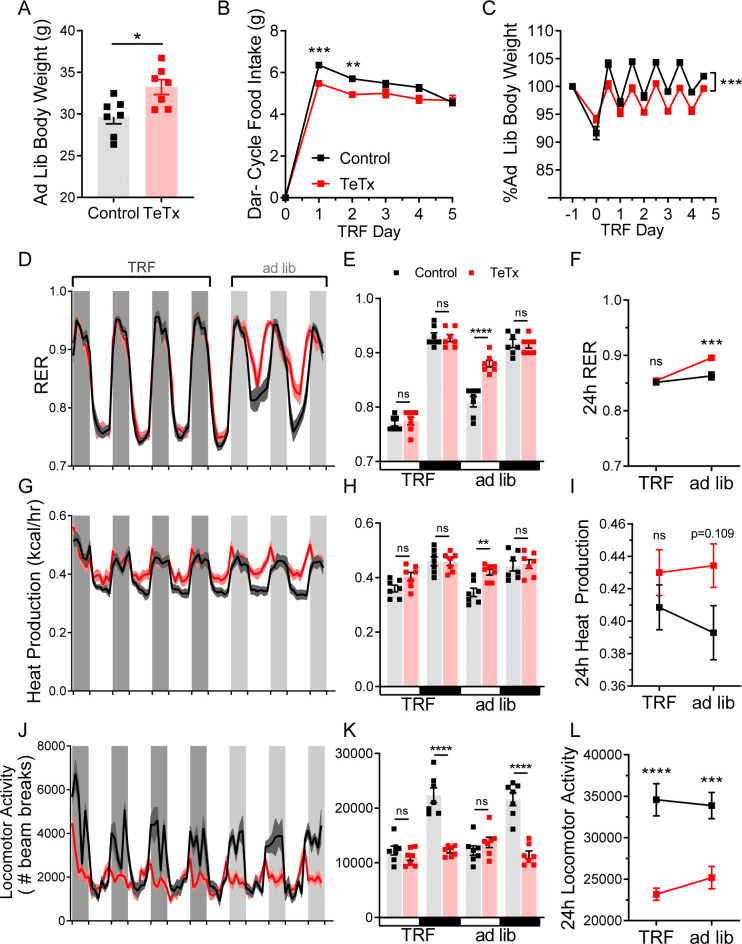
Figure 4. DMHLepR neurons are required for adaptation to a dark-cycle restricted feeding schedule.
(A) Experimental timeline. Six weeks following bilateral microinjection of Cre-dependent GFP:TeTx (TeTx; n=7) or GFP control (control; n=7) to the dorsomedial hypothalamic nucleus (DMH) of LepR-Cre+ male mice, mice were acclimated to time-restricted feeding (TRF) in their home cages for a 5-day lead-in before transfer into direct calorimetry. TRF was maintained in calorimetry for an additional 4 days, followed by ad lib feeding. (B) Two-hour binned continuous measures of food intake during TRF and transition back to ad lib feeding. Shaded areas indicate dark cycle (ZT14–ZT24). (C) Mean L:D food intake from (B) under TRF and ad lib feeding. Two-way ANOVA: F(1,12)=5.084; p=0.0436 (main effect of TeTx); F(3,36)=27.91; p<0.0001 (time x TeTx interaction). (D) Mean 24-hr food intake from (C) during TRF and ad lib feeding. Two-way ANOVA: F(1,12)=5.097; p=0.0434 (main effect of TeTx); F(1,12)=47.8; p<0.0001 (main effect of TRF); F(1,12)=19.58; p=0.0008 (TRF x TeTx interaction). Within treatment comparison (TRF vs. ad lib): control t(12)=1.759; p=0.1971; TeTx t(12)=8.018; p<0.0001. Data are mean ± SEM. For repeated measures, post hoc, Sidak’s test at each time point is indicated on the graph. *p<0.05,**p<0.01, ***p<0.001, ****p<0.0001.


