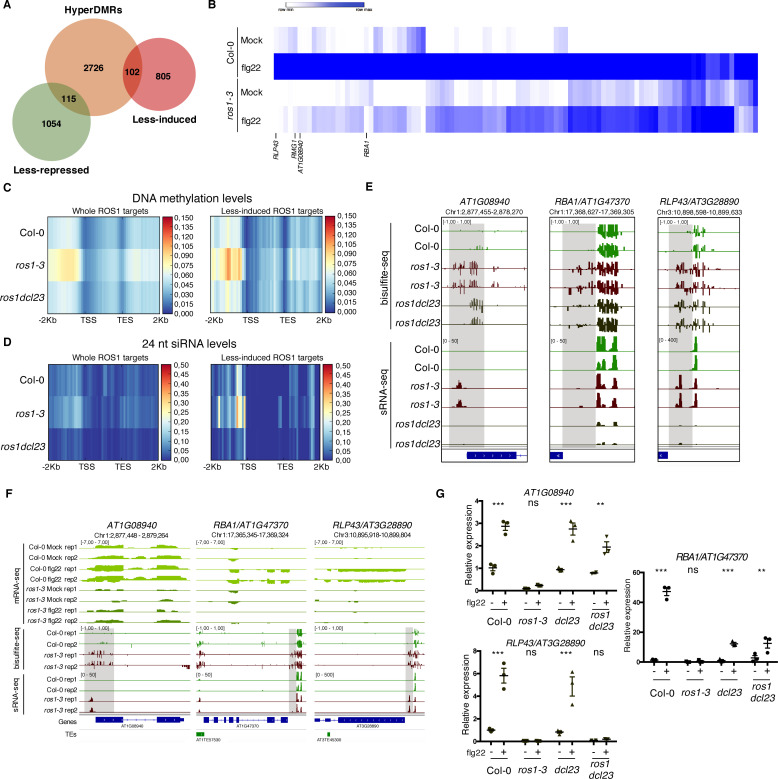
Figure 3. Genome-wide identification of flg22-responsive ROS1 targets and characterisation of the role of RNA-directed DNA methylation (RdDM) in the methylation status of these genes in the absence of ROS1.
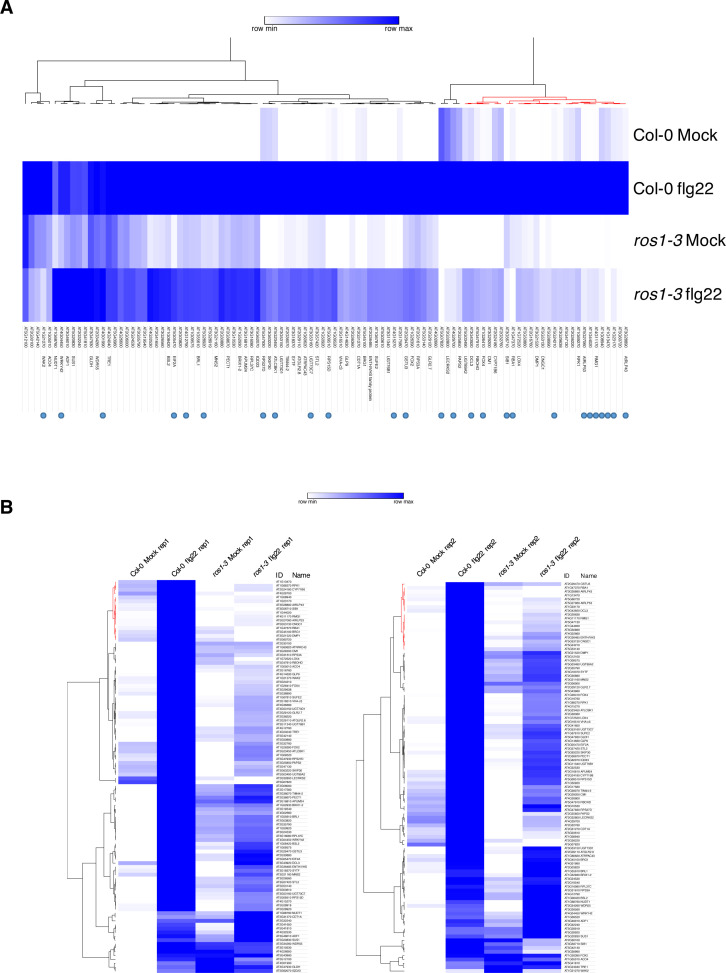
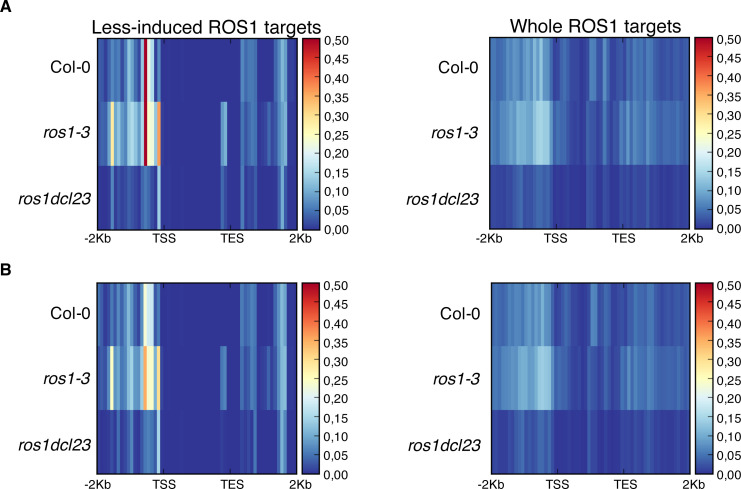
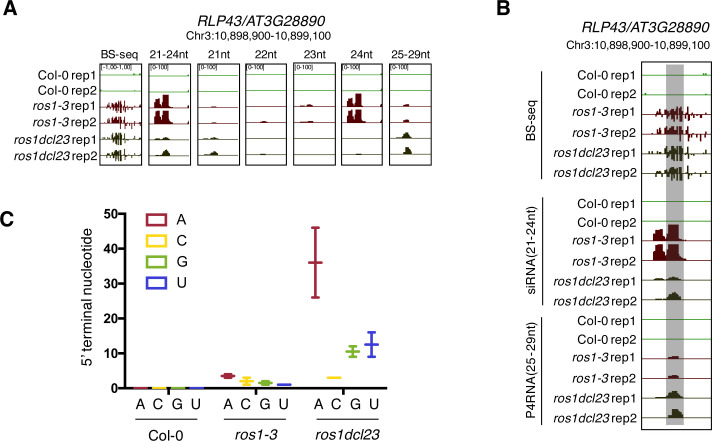
(A) Proportion of flg22-responsive genes that are regulated by ROS1. One hundred and two flg22-responsive genes that are ‘less-induced’ and 115 flg22-responsive genes that are ‘less-repressed’ in ros1-3-elicited mutant exhibit hypermethylated DMRs (hyperDMRs). Venn diagram representing the overlap of genes presenting hyperDMRs in the ros1 mutant (in orange) with genes presenting a compromised induction (in red) or repression (in green) in ros1-3 compared to Col-0 treated with mock (water) or 1 μM of flg22 for 6 hr. (B) Heat map representing the relative expression of the 102 less-induced genes in Col-0 and ros1-3 treated with mock (water) or 1 μM of flg22 for 6 hr. Merged data from two independent biological replicates are presented. (C) Increased global DNA methylation levels observed in untreated ros1-3 compared to Col-0 at the whole set of genes exhibiting hyperDMRs (left panel) and at the 102 less-induced genes (right panel) are restored in the ros1dcl23 triple mutant. Heatmap representing global DNA methylation levels within regions comprising 2 Kb upstream of the transcription start site (TSS), the gene body, and 2 Kb downstream of the transcription end site (TES) of the whole set of genes exhibiting hyperDMRs in ros1-3 versus Col-0 (left panel) and of the 102 less-induced genes (right panel). These heatmaps were generated from BS-seq data sets obtained from 5-week-old rosette leaves of Col-0, ros1-3, and ros1dcl23 mutants. (D) Increased 24 nt siRNA levels in ros1-3 at the whole set of genes exhibiting hyperDMRs in ros1-3 versus Col-0 (left panel) and at the 102 less-induced genes (right panel) are restored in the ros1dcl23 triple mutant. Heatmap representing 24-nt siRNA levels within regions comprising 2 Kb upstream of the TSS, the gene body, and 2 Kb downstream of the TES of the whole set of genes exhibiting hyperDMRs in ros1-3 versus Col-0 (left panel) and of the 102 less-induced genes (right panel). These heatmaps were generated from sRNA-seq datasets obtained from 5-week-old rosette leaves of untreated Col-0, ros1-3 and ros1dcl23 mutants. Average of the two replicates is represented. (E) Methylation levels are restored at AT1G08940 and partially restored at RBA1 in ros1dcl23 whereas RLP43 retains methylation levels similar to methylation levels observed in the single ros1-3 mutant. IGV snapshots showing siRNA levels and methylation levels at the DMRs of AT1G08940, RBA1, and RLP43 in Col-0, ros1-3, and ros1dcl23. (F) IGV snapshots depicting mRNA-seq data in Col-0 and ros1-3 mutant in mock- and flg22-treated conditions as well as BS-seq and sRNA-seq of untreated Col-0 and ros1-3 plants. (G) AT1G08940 gene induction is restored and RBA1 gene induction is partially restored whereas RLP43 remains in a repressed state in ros1dcl23. RT-qPCR analyses from 5-week-old rosette leaves of Col-0, ros1-3, dcl23, and ros1dcl23 treated with either mock (water) or 1 μM of flg22 for 6 hr. The mRNA levels are relative to the level of UBQ transcripts. Statistical significance of flg22 treatment on expression was assessed using a two-way ANOVA test and a Sidak’s multiple comparisons test. Asterisks indicate statistical significance (*: p<0.05, **: p<0.01, ***: p<0.001, ns: not significant).


