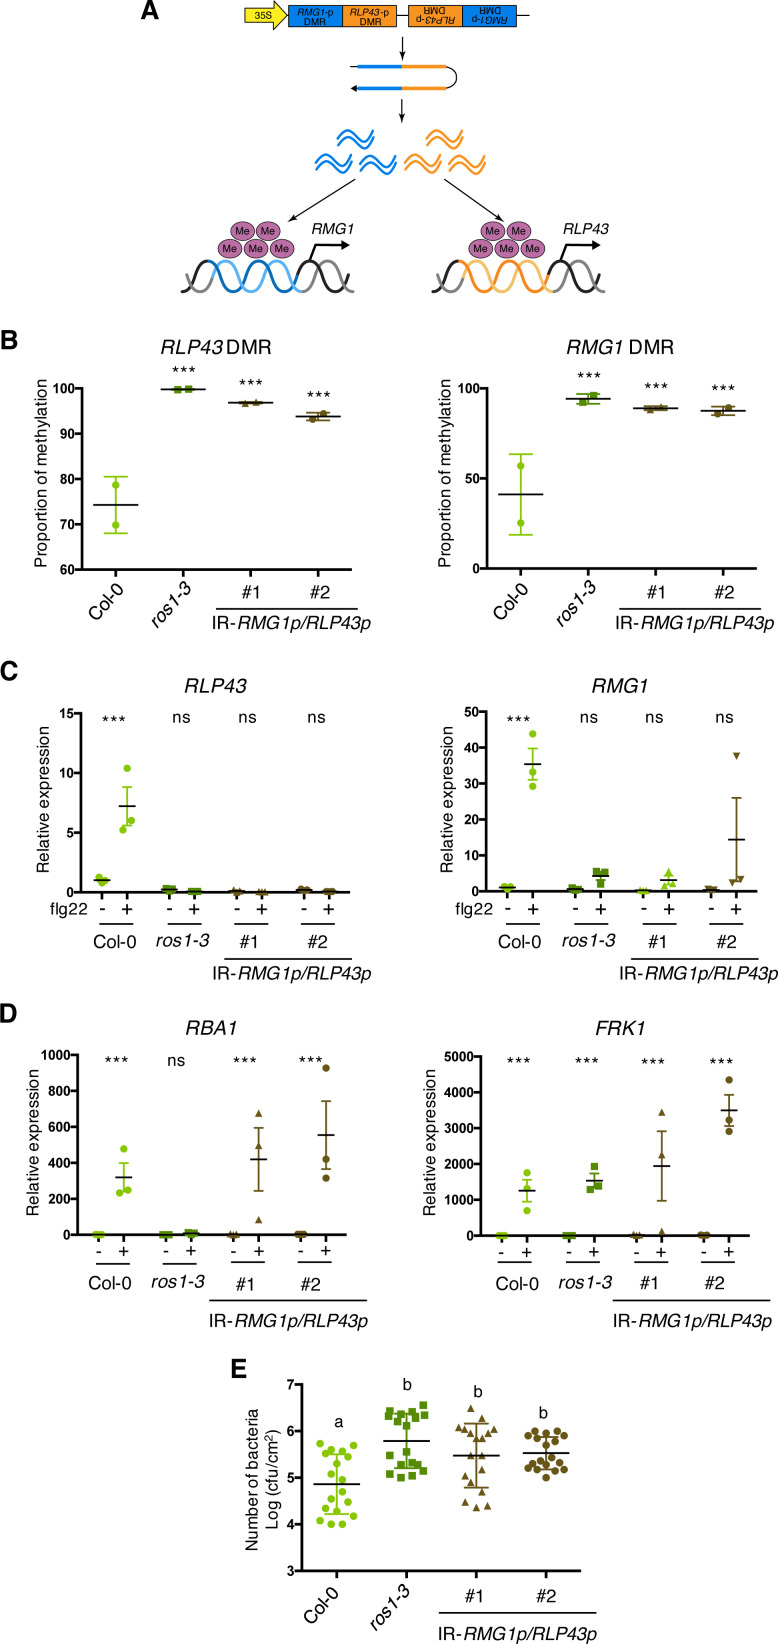
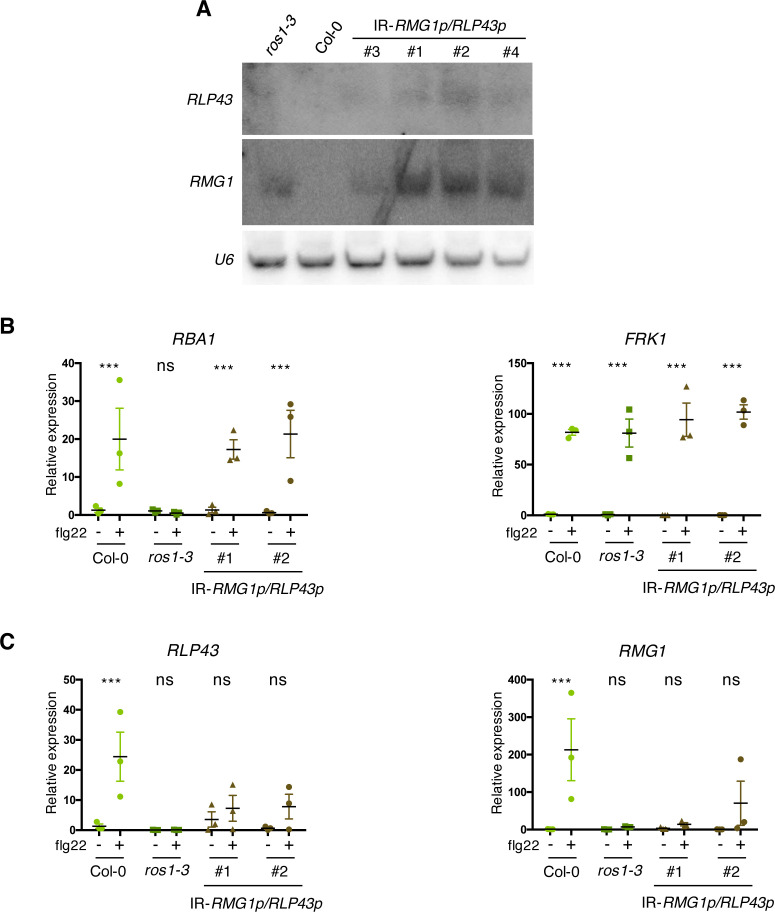
Figure 6. The artificial siRNA-directed targeting of remethylation at the RMG1 and RLP43 promoters impairs the flg22-triggered inducibility of these genes and enhances susceptibility towards Pto DC3000.
(A) Scheme depicting the chimeric inverted repeat (IR) construct designed to simultaneously direct DNA remethylation at the RMG1 and RLP43 promoter regions. The IR-RMG1p/RLP43p contains the sequences corresponding exactly to the promoter sequence regions of RMG1 (blue) and RLP43 (orange) that are subjected to ROS1-directed demethylation in Col-0 and hypermethylated in ros1 mutants. This inverted repeat transgene is driven by the constitutive 35S promoter, hence hypothesized to constitutively produce two populations of siRNA species designed to force remethylation of the RMG1 and RLP43 promoter regions that are normally demethylated by ROS1 in Col-0. (B) The RMG1 and RLP43 promoters exhibit hypermethylation in IR-RMG1p/RLP43p lines such as in ros1-3 mutants. Genomic DNAs from Col-0, ros1-3, and two independent IR-RMG1p/RLP43p lines (two biological replicates per line) were digested using McrBC and further analysed by qPCR. Ratio between digested DNA and undigested DNA was quantified to assess the proportion of methylation. (C) The flg22-triggered induction of RMG1 and RLP43 is impaired in the two independent IR-RMG1p/RLP43p lines. Five-week old rosette leaves of Col-0, ros1-3, and two independent IR-RMG1p/RLP43p lines were syringe-infiltrated with either mock (water) or 1 μM of flg22 for 6 hr, and the mRNA levels of RMG1 and RLP43 were monitored by RT-qPCR analyses. The mRNA levels are relative to the level of UBQ transcripts. Statistical significance of flg22 treatment on expression was assessed using a two-way ANOVA test and a Sidak’s multiple comparisons test. Asterisks indicate statistical significance (*: p<0.05, **: p<0.01, ***: p<0.001, ns: not significant). (D) The flg22-triggered induction of RBA1 and FRK1 is not affected in the two independent IR-RMG1p/RLP43p lines. Five-week old rosette leaves of Col-0, ros1-3, and two independent IR-RMG1p/RLP43p lines were syringe-infiltrated with either mock (water) or 1 μM of flg22 for 6 hr, and the mRNA levels of RBA1 and FRK1 were monitored by RT-qPCR analyses. The mRNA levels are relative to the level of UBQ transcripts. Statistical significance of flg22 treatment on expression was assessed using a two-way ANOVA test and a Sidak’s multiple comparisons test. Asterisks indicate statistical significance (*: p<0.05, **: p<0.01, ***: p<0.001, ns: not significant). (E) IR-RMG1p/RLP43p lines exhibit increased Pto DC3000 titre. Five-week-old plants of Col-0, ros1-3, and two independent IR-RMG1p/RLP43p lines were dip-inoculated with Pto DC3000-GFP at 5 × 10⁷ cfu ml−1. Bacterial titres were monitored at 3 days post-infection (dpi). Each data point represents bacterial titre extracted from a single leaf. Three leaves out of four plants per line and from three independent experiments were considered for the comparative analysis. Statistical significance was assessed using a one-way ANOVA test and Tukey’s multiple comparisons test.


